The goal of this lab is to give you practice working with arrays, ArrayLists, and files. In the first part of the lab, you will focus on using a 1D arrays of primitives. In the second part, you will work with a 1D array of objects. Finally, in the last part, you will be given code to read in the data from a text file.
Many of the problems in the Basic Array Problems are similar to the methods you must implement below. Try to do the problems below first but if you have trouble, take a look at the solutions for the Basic Array Problems. Many of these basic problems will be covered in class and are also discussed in your text.
// Mean July temperatures in Salem, Oregon from 1903 to 2015
private double temperatures [] = {
63.6,66.8,68.8,72.0,67.6,70.4,62.9,67.2,69.5,67.0,
66.1,68.3,66.5,64.2,69.0,66.3,66.7,64.7,65.1,69.5,
67.6,67.3,69.3,70.8,69.6,68.0,65.2,62.4,66.6,63.7,
65.0,64.5,65.9,65.5,65.7,69.2,67.8,66.5,72.0,68.6,
67.0,67.7,68.1,67.3,65.7,65.5,66.0,67.3,66.7,67.5,
64.6,62.7,62.4,67.7,64.5,71.2,67.9,67.6,67.5,64.3,
61.9,66.4,67.2,65.2,67.6,66.1,64.9,67.2,67.3,67.5,
67.4,65.8,67.0,65.3,64.5,68.8,67.9,65.5,65.0,65.6,
64.3,65.4,70.1,63.5,64.8,66.8,64.6,69.6,68.0,68.9,
63.2,69.1,68.5,70.2,66.9,69.6,66.1,66.0,66.0,68.8,
70.2,70.0,68.9,69.8,69.9,68.0,71.2,67.5,65.9,66.8,
70.5,72.5,72.8};
Add another member variable that contains the starting year (i.e. 1903)
Add methods:
year: 1903 temperature = 63.6
year: 1904 temperature = 66.8
year: 1905 temperature = 68.8
year: 1906 temperature = 72.0
year: 1907 temperature = 67.6
year: 1908 temperature = 70.4
year: 1909 temperature = 62.9
year: 1910 temperature = 67.2
year: 1911 temperature = 69.5
year: 1912 temperature = 67.0
year: 1913 temperature = 66.1
...
Salem Mean July Temperatures
Range shown is from 0 to 72.8 ( one "*" corresponds to 1 degree)
1903:  63.6 ****************************************************************
1904:  66.8 *******************************************************************
1905:  68.8 *********************************************************************
1906:  72.0 ************************************************************************
1907:  67.6 ********************************************************************
1908:  70.4 **********************************************************************
1909:  62.9 ***************************************************************
1910:  67.2 *******************************************************************
1911:  69.5 **********************************************************************
1912:  67.0 *******************************************************************
1913:  66.1 ******************************************************************
Another more challenging way to do this exaggerates the differences by drawing only the region between the min and max, scaling the results so it fits across the width of the window. If you want a challenge do it this way, otherwise, do it the above simpler way. In this case, the result would look like:
Salem Mean July Temperatures
Range shown is from 61.9 to 72.8
1903:  63.6 ************
1904:  66.8 ***********************************
1905:  68.8 **************************************************
1906:  72.0 **************************************************************************
1907:  67.6 *****************************************
1908:  70.4 **************************************************************
1909:  62.9 *******
1910:  67.2 **************************************
1911:  69.5 *******************************************************
1912:  67.0 *************************************
1913:  66.1 ******************************
(Optional) If you have time, add some additional methods that could be interesting when analyzing the data, For example, a method that prints all year/temps that are above (or below) a specific temperature could help you see if temperatures have been warmer in the more recent years.
Thoroughly test your program, for example, executing the following code below in main and comparing to the output here.
Temperatures temps = new Temperatures();
System.out.println("Start year: " + temps.getStartYear());
System.out.println("Number of years of data: " + temps.getNumberOfYears());
System.out.println("Temperature data:\n" + temps);
System.out.println("Temperature at index 2: " + temps.temperatureAtIndex(2));
System.out.println("Temperature in year 1910: " + temps.temperatureAtYear(1910));
System.out.println("Average July temperature: " + temps.calcAverage());
System.out.println("Max July temperature: " + temps.getMax());
System.out.println("Min July temperature: " + temps.getMin());
System.out.println("Median July temperature: " + temps.getMedian());
double [] tempCopy = temps.getTemperatureArray();
tempCopy[0] = 100;  // this should not change the original array!
System.out.println("Orig: Temperature at index 0: " + temps.temperatureAtIndex(0));
System.out.println("Copy: Temperature at index 0: " + tempCopy[0]);
System.out.println("\n"+temps.graph());
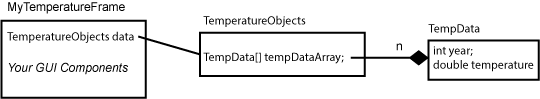
In the above program, you worked with an array of primitive types (i.e. doubles). The downside is that it was not always possible to maintain the connection between the year and the temperature. For example, when you sorted the temperatures, you had no way of knowing what year each temperature corresponded to. This can easily be fixed by creating an array of objects where each object encapsulates the related items (in this case, the year and temperature).
In this part of the lab, you will create a simple class that holds a year and a temperature. You will then create another class which contains an array of the simple class. By adding a compareTo() method, we will be able to use the Arrays class to sort the array. Once sorted, you can print out the sorted list where each object maintains the grouping of the year and temperature. This will enable us to observe how the temperature is related to year and ask questions such as "are most of the hottest years more recent?"
Instructions:
year: 1954 temp: 62.7public int compareTo(TempData t)public class TempData implements Comparable<TempData>We say that Comparable is an interface. Interfaces require that you implement certain methods that have specified headers, in this case, we need the compareTo method with the header given above.
If the TempData class includes a .compareTo method which compares TempData objects based on the value of their temperature, then we can sort the array. And, since the year and temperature are encapsalated together in the TempData object, we are able to maintain the relationship between the year and the temperature.
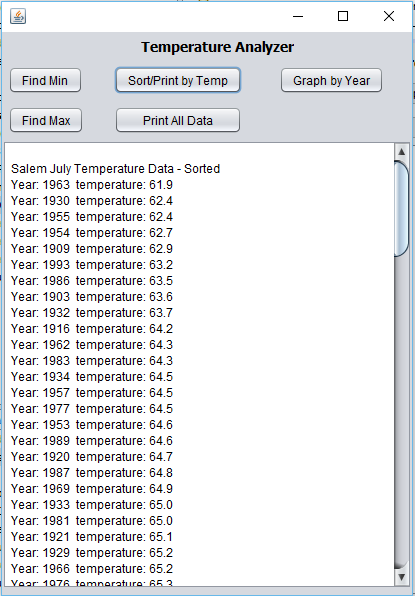
Finally, create a JFrame. Add a TemperatureObjects member variable to your JFrame as shown in the picture above. Add components so that your JFrame implements the following functions and looks something like:
In this part of the lab, you are to read in the array of temperature values from a file.
double temperatures[] = {
63.6, 66.8, 68.8, 72.0, 67.6, 70.4, 62.9, 67.2, 69.5, 67.0,
66.1, 68.3, 66.5, 64.2, 69.0, 66.3, 66.7, 64.7, 65.1, 69.5,
...};MyFileReader reader = new MyFileReader("src\\your_package_name\\meanJulyTemp1903to2015.txt");
double temperatures[] = reader.data;MyFileReader reader = new MyFileReader("src/your_package_name/meanJulyTemp1903to2015.txt");Compile and run your program. It should run exactly as before. The advantage of having the data in a file is that:
To receive full credit, you need to:
Make sure that your Java code:
Demonstrate:
Submit the following 4 files to Wise as attachments to Lab 8