(Demo in class on Monday, Sept 11) Create a scene, e.g. a chess set, a car, or crude "human" figure. You may want to stick with wireframe objects since solid objects are hard to see without lighting. Later on in the course, after we have talked about lighting and shading, you can go back and fill in the shapes.
(Not collected) Take a look at the Wave.java. It introduces animation and shows how one can plot a function of 2 variables. This program loops over an (x,y) grid to calculate the height z = f(x,y) and then plot (x,y,z) (actually, at each iteration, 4 points forming a square are calculated). Your job is to 1) understand the code, 2) change the comments so the surface is plotted as a checkerboard, and 3) replace the function with a different one of your choice. For 3), you may need to change the range and the viewing angle. Can you get the wave to actually undulate?
(Turn in and Demo in class on Monday, Sept 18) This is very similar to the wave program but deals with more complex surfaces. Do one of the following:
Plotting an Algebraic Surface: The wave program loops over an (x,y) grid to calculate the height z = f(x,y) and plot the point (x,y,z). In this problem, you are to loop over a grid of parameters (e.g. r,t) and at each r,t calculate the xyz value. For example, look at Steiner's Roman Surface on the web page discussing affine trig parameterization of the surfaces at Steiner Surfaces. Create a wireframe to begin with then experiment with using different ways of representing the vertices (points, quads, etc). If you use quads, you will have to play around with the color so that you can see detail.
Digital Elevation Models: Read in either an ascii or image dem map. Sample ascii data is here. The first two numbers are the number of columns and rows. A snippet of code for reading in this file is given here. Note, this is not complete code - it includes the necessary imports and a method for reading the ascii file.
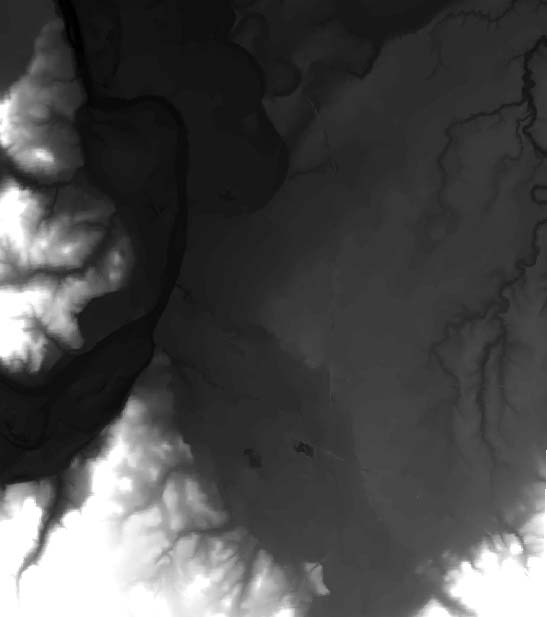
Depending on how comfortable you are with java, you might want to read in a DEM image (e.g. see the image for Salem) and plot that. This is challenging and if you aren't careful, will result in memory overflows.
To turn in: Please add javadoc comments to your code. Generate the javadoc and the jar file. Demo the code in class. Zip together the entire netbeans project (delete unused files) and email to gorr@willamette.edu. Be sure to put "CS445 Project 1" in the subject line.
[top] [Schedule] [CS445 Home]