---
title: "Fourier Analysis"
author: Jed Rembold
date: February 18, 2025
slideNumber: true
theme: tokyo-night-light
highlightjs-theme: tokyo-night-light
width: 1920
height: 1080
transition: slide
p5js: true
---
## Announcements
- Homework 3 is coming out today!
- Due in approx just under 3 weeks
- I'll be scheduling short one-on-one meetings at that point to discuss with you how you are doing as a partner
- Schedule Rejiggering
- I am still working out details, but will likely be bumping HW deadlines back a few days to Sunday or Monday nights to give you more time after our last content lecture
- Means the check-in / debrief timing might shift some as well
- Quiz at the end of Thursday's class! Study up!
## Today's Plan
- Why can determining periodicity be difficult?
- What is a Fourier transform?
- How can I use a Fourier transform to extract information from a signal?
# Tricky Periodicity
## Periodicity
- Identifying repetition in observations often gives important information about a source or event
- There are no limits on the shape of the observation beyond that it repeats
- Signal may be smooth, like a sine wave
- Signal may be something non-continuous, like a square wave
- Signal can be a combination of several underlying signals that all repeat differently
- The _period_, often denoted with a $T$, of an observation is the elapsed time between repetitions
## The "Easy" Case
- For simple, known repeating functions, you might think just fitting the data would work
- It _can_, but it can also be surprisingly susceptible to initial parameter guesses
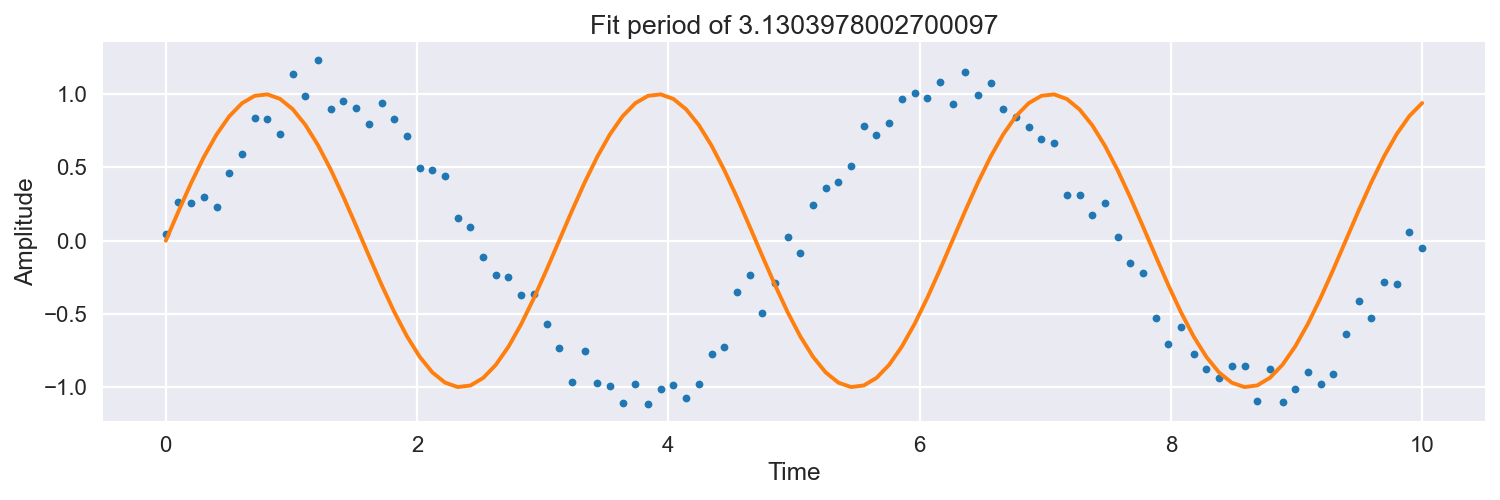{width=80%}
## Frequency
:::{style='font-size:.95em'}
- There are multiple ways to think about how fast an event or observation repeats
- We've already mentioned that the period is the time between repetitions
- Alternatively, we could talk about how many repeats occur within a certain time
- This is called the _frequency_, generally indicated with an $f$
- The period of a repeating event and the frequency of that event are easily correlated:
$$ T = \frac{1}{f} $$
- Frequency is thus in units of 1 over time. If time is measured in seconds, this unit is called a _hertz_
:::
## Complications
- If the period of your signal is small compared to the frequency of your observations, it can be nearly impossible (or actually impossible) to tease out the period
- Making a simple fit to the signal rapidly becomes unfeasible if the signal is a combination of several periodic sources
- Even if you **know** the number of periodic sources and can model it mathematically
- If fitting even a single basic sine wave is sensitive to initial guesses, it gets worse with more complexity
## Another Way
- We need better ways to find and determine periodic behavior in data
- One method is to construct a periodogram
- A periodogram is a visual representation of the strength of differing periodic signals to a combined signal
- Periodograms are inherently related and linked to Fourier Series and the Fourier Transform
# For Who?
## Fourier Series
:::{style='font-size:.95em'}
- **Any** periodic function can be represented by summing together many differing sine waves of different amplitudes, periods, and phases
- A generic sine wave would have a form of:
$$ A\sin\left(\frac{2\pi t}{T} + \phi\right) $$
- The _Fourier Series_ of a periodic function is just the infinite series of all the sine wave contributions that could be added together to exactly equal that periodic function
- 3Blue1Brown has several _excellent_ videos on Fourier series and the (upcoming) Fourier Transform that you should check out on YouTube
- This lets us just focus on finding and determining sinusoidal periodic repetition
:::
## The Fourier Transform
- The _Fourier Transform_ shifts data from looking at how it changes over time, to looking at how it changes over different frequencies
$$ \hat{g}(f) = \int_{-\infty}^\infty g(t) e^{-2\pi i f t}\,dt $$
- This value will generally be a complex number
- Fourier transforms are symmetric about the y-axis, since periodic motion can occur in either direction
- You can generally just focus on the positive values.
## The Transform Visualized
## Getting Powerful
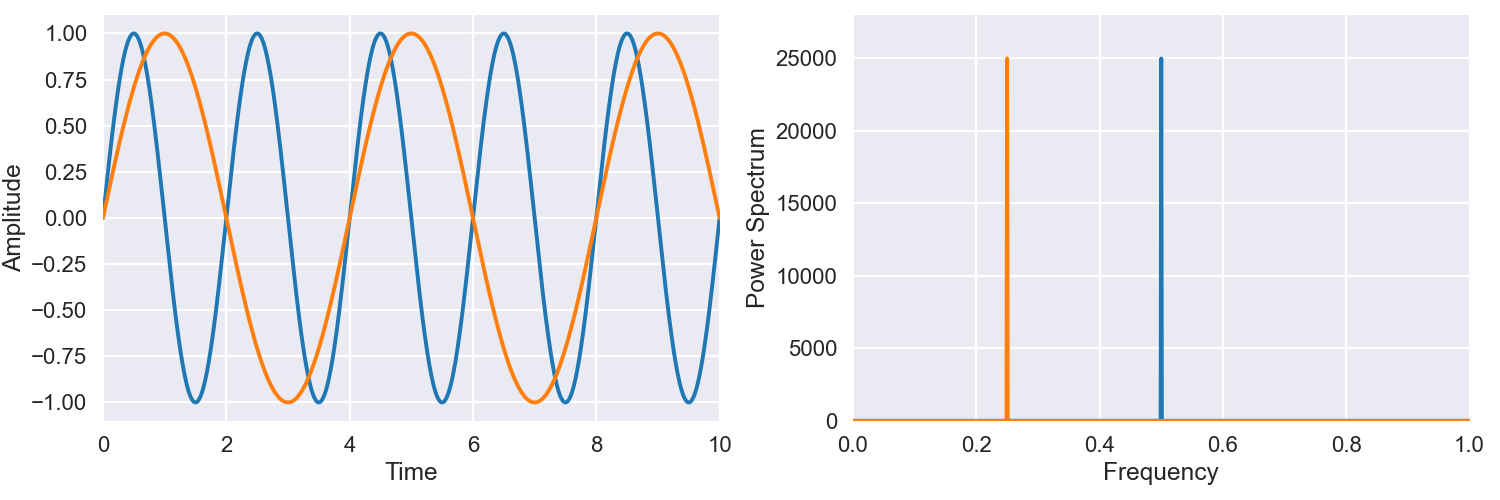
- A larger magnitude of $\hat{g}(f)$ implies a greater contribution of that frequency $f$ to the original signal
- The goal is to compute this magnitude over a wide range of frequencies and then see which frequencies contribute the most
- Commonly actually computer the squared magnitude as $\left|\hat{g}(f)\right|^2$, known as the _power spectrum_
## Examples
{width=70%}
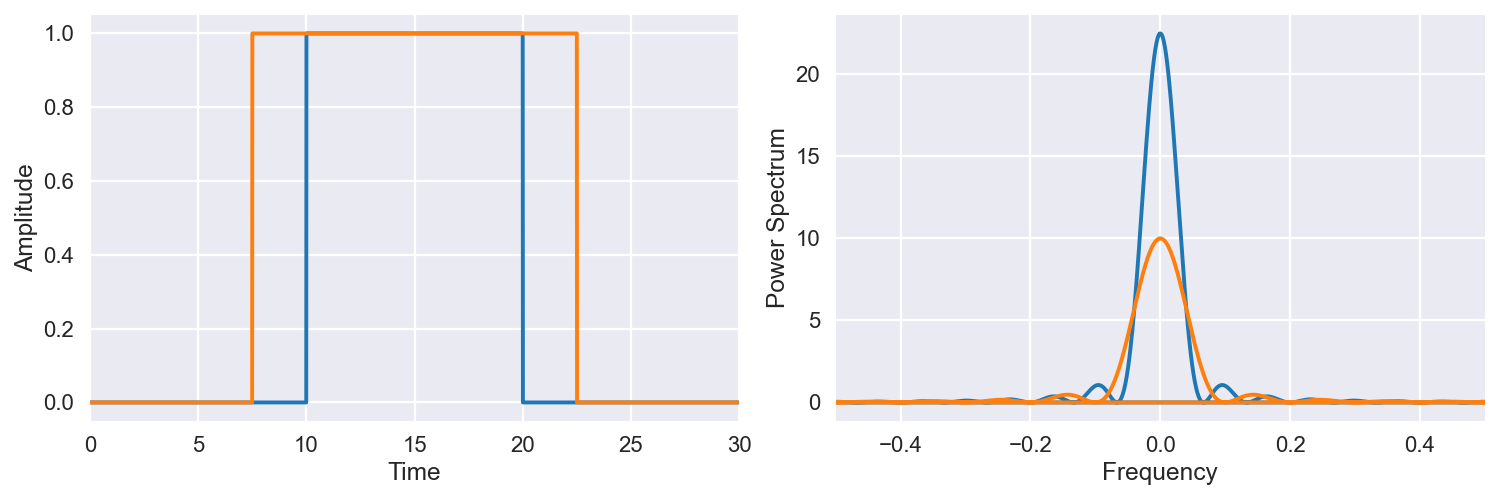{width=70%}
# Computational Fourier Transforms
## The Discrete Fourier Transform
- When computing a Fourier Transform from data, we are technically always computing the _Discrete Fourier Transform_, since we only know the value of the function at certain points
- This absolutely will have ramifications in terms of what we end of seeing, but I'd like to postpone that discussion for just a bit
- So long as the data looks mostly like an infinite continuous series, the DFT will closely mimic the continuous Fourier Transform previously defined
- Spacing of data points relatively close together relative to the period
- Data available over many full periods
- The classic algorithm for computing a DFT is the _Fast Fourier Transform_, which is what libraries will generally make available in different languages
## Python FFT
- You can access functions to perform a FFT from several libraries in Python:
- Numpy has it in `np.fft`, and offers several variants
- Scipy has it in `scipy.fft` and also offers several variants
- In both:
- The `fft` function will return complex output, symmetric about 0
- The `fftfreq` function will generate a list of the corresponding frequencies to plot the power spectrum against
- The `rfft` function will return complex output, only include positive frequencies
- The `rfftfreq` function will generate a list of the corresponding frequencies to plot the rfft power spectrum against
## R FFT
- In R, the FFT function is defined in the `stats` library
- Only offers the `fft` function, which will return complex output, symmetric about 0
- No function that corresponds to `fftfreq` in Python
- I wrote an R package to give you this functionality: `fftutils.r`
## Example
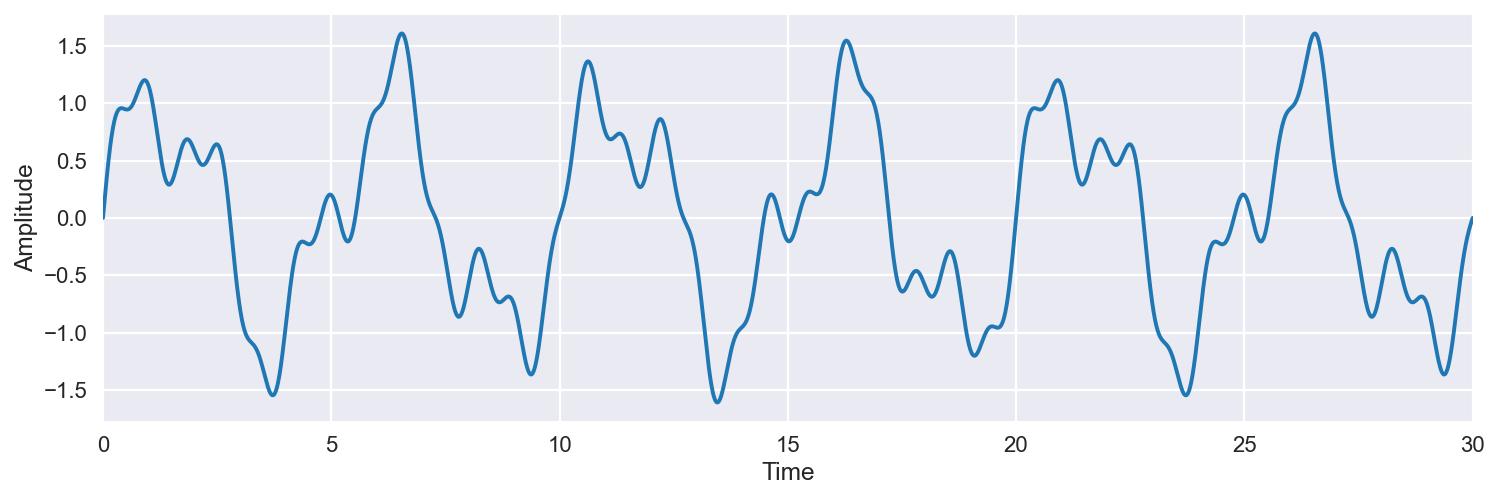
- Suppose I wanted to try to decompose the following wave into its various parts. Data available [here](../demos/multi_wave.csv).
# Determining all wave properties
## The Classic Periodogram
- Related to the power spectrum, the classic, or Schuster, periodogram is defined as:
$$ P_S(f) = \frac{1}{N}\left|\mathcal{F}(f)\right|^2 $$
where $N$ is the number of discrete measurements in the observing window
- Differs from the power spectrum by a factor of $\tfrac{1}{N}$, which accounts for the fact that otherwise longer signals will have higher power spectrum values
- Technically, the periodogram is our observational statistic, which serves as an _estimator_ for the underlying power spectrum
## Amplitudes and Phases
- Periodograms can help identify the prominent frequencies, but what if you want the other sinusoidal parameters?
- Amplitude: determined from just the magnitude of the FFT scaled by the number of observations
$$ A = \frac{1}{N} \left| \mathcal{F}(f) \right| \times 2 $$
- The $\times 2$ comes from the symmetric nature of the FFT
- Phase: determined from the angle formed by the real and imaginary parts of the FFT
$$ \phi = \arctan\left(\frac{\operatorname{Im}(\mathcal{F}(f))}{\operatorname{Re}(\mathcal{F}(f))}\right) $$
- The returned phase is in radians
# Back it Up
## The Inverse FFT
- You can also go backwards!
- The _Inverse Fourier Transform_ moves you back from the frequency-domain to the time-domain
- In Python, this is given by `ifft`
- In R, use the `inverse = TRUE` flag inside `fft`
- Make it possible to filter out certain frequencies, and then transform back to a clean signal
## Activity!
- I've generated noisy data of a single oscillation [here](../demos/dopplerdata.csv).
- Your task is to determine the period/frequency, filter out everything else, and then transform that signal back and plot it atop the original noise
## HW3 Groups!
- You have a bit of time now to touch base with your new partner!
::::::{.cols style='align-items: flex-start'}
::::col
:::{.block name='Left side'}
- Conor & Clay
- M & Ema
- Mamadou & Gabby
- Aurora & Elliott
- Maddie & Sadie
- Jared & Luca
- Salem & Izzy
:::
::::
::::col
:::{.block name='Right side'}
- Tegan & Sawyer
- Luna & Sage
- Lucca & Sergio
- Pearson & Greg
- Evyn & Evan
- Oscar & Felicity
:::
::::
::::::