Yes, I am definitely behind in feedback now. Trying to get that
mostly rectified by the end of the week
Aiming to have Quiz 1 scores back to you by Wednesday
Recap
Looking at discrete Fourier transforms brings extra effects:
The overall observing window controls the broadness of the found
peaks
Smaller windows make for broader peaks
The sampling rate determines how often we get aliased peaks
Finer sampling results in further spaced aliases
Discussing Today
What is the limit of frequencies we can detect?
What happens when observations are not consistently spaced?
The Lomb-Scargle Periodogram
Exoplanet Hunting:
Astrometric Method
Doppler Method
Taking it to the Limit
The Lower Limit (in \(f\))
If we are trying to figure out the smallest frequency that we could
measure (largest period) we have simply to look at our data’s
x-axis
FFT’s look for periodic motion. So if at least one period has not
happened within the window of your data, it becomes impossible to
see!
As such, the maximum period is just equal to your data’s observation
window
And the minimum frequency computed accordingly
The Upper Limit (in \(f\))
To see periodic motion, we need at least two measurements per cycle
One high, and one low
If our time between samples is too high, we will “see” very
different (and incorrect) frequency contributions (Notebook demo)
This corresponding frequency is call the Nyquist Frequency,
and is computed as \[f_{nyq} =
\frac{f_{sampling}}{2}\]
This is the max frequency that fftfreq
gives you
Spectral Resolution
Small windows broaden peaks
Slow sampling rates brings aliases closer together
Too much of both, and your signals can start to merge, making it
extremely difficult to see anything useful
Variety is the Spice of Life
Non-uniform Observations
We don’t always get to have perfectly uniform observations!
Non-uniform observations add what will seem to be “noise” to the FFT
Effects of small segments of periodicity between various
observations
Non-uniform FFT
In practice, computing a DFT using a computational FFT can be
problematic, since the returned frequencies are computed assuming a
uniform spacing
The d in
fftfreq(n, d)
You could super-sample the observations, adding an evenly spaced
grid with 0’s wherever no data exists
Still might be difficult to get an evenly spaced grid that exactly
contains all observations
A better option though is to shift to a slightly different
estimator: the Lomb-Scargle Periodogram
Lomb-Scargle Methods
Lomb-Scargle
Lomb and Scargle considered a more generalized form of the
periodogram, with added functions \(A\), \(B\), and \(\tau\), and then showed that you could
choose those functions such that:
The periodogram reduces to the classical form for evenly spaced
observations
The periodogram’s statistics are analytically computable
The periodogram is insensitive to global time-shifts in the
data
The same basic insights we had with the classic periodogram will
still hold qualitatively with Lomb-Scargle, even if not exactly the same
quantitatively
The real price you pay vs the FFT periodogram is that you have to
decide on the frequencies to sample, which may lead to visible
aliases.
Lomb-Scargle in Python
Scipy’s Signals library provides an implementation of the
Lomb-Scargle periodogram
from scipy.signal import lombscargle
Works with angular frequencies: \[\text{Angular frequency } = \omega =
\frac{2\pi}{T} = 2\pi f \]
You need to provide 3 arrays:
The sequences of observation times
The observed signal
The desired angular frequencies to compute the periodogram over
power = lombscargle(ts, signal, afreqs, floating_mean=True)
Lomb-Scargle in R
Install the “lomb” library to get access to nice Lomb-Scargle
functions in R
install.packages("lomb")
Works with normal frequencies!
You can actually have it work directly in terms of period as well if
you like
Need to provide:
Observation times
Observed signals
Starting and stopping frequency/period values
model <- lsp(df, from=0.001, to=1)
Dealing with Aliases
When data is sampled unevenly, it is often sampled in batches
These batches often have their own underlying
period, which can show up as aliases
If we knew what the underlying sampling frequency/periods were, we
could compute where the aliases would be using: \[f_{alias} = \left| f_{signal} \pm k \cdot
f_{sampling} \right| \]
But, given that the sampling is uneven, how could we figure out
\(f_{sampling}\)?
Measuring the Spectral Window
One common way to do this is to create a data-set with zero
y-dependence
Generally done by setting every y-value to 1
Then you do the exact same Lomb-Scargle operation (on the same
times) but on that constant column
This effectively removes any contribution to the period from the
y-axis, and means anything you see is the result of the x-axis
See a strong peak in the resulting periodogram? That indicates a
periodicity in your sampling, and you can use that as \(f_{sampling}\)
Demo
The file here is of a
simple sine wave with noise added.
It has been sampled semi-randomly to create a non-uniform sample
rate, but one which does show some periodicity.
Our goal is to use Lomb-Scargle to extract the period and identify
all corresponding aliases.
The Exoplanet Quest
Why are planets so hard to see?
Exoplanets are planets orbiting stars that are not our own
Sun
Commonly far too tiny to be observed directly
Recall we can’t even resolve most stars
We must then rely on other, more subtle measures
Gravity Tugs!
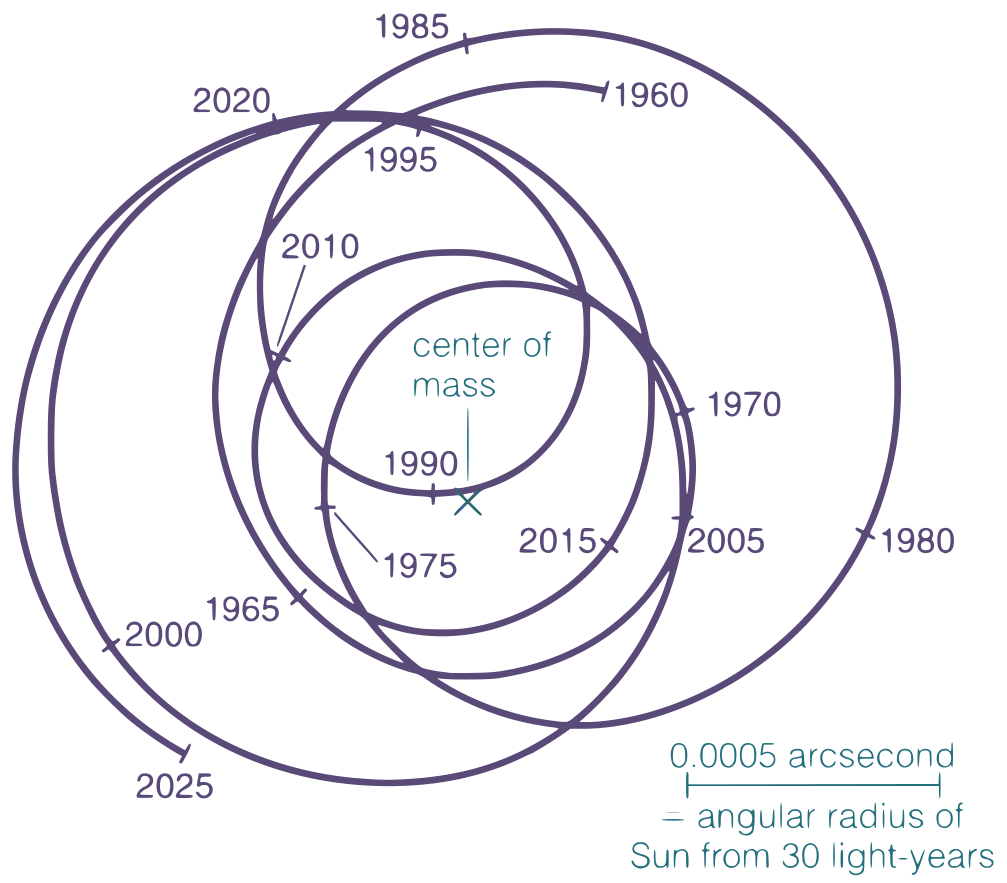
Planets and their host stars actually orbit the center of
mass between the planet and its star
In most system, this point might still be inside the radius of the
star, but it is not at the center of the star
As the star oscillates then, you get a bit of “wobble”
Most pronounced for massive planets far from their host star
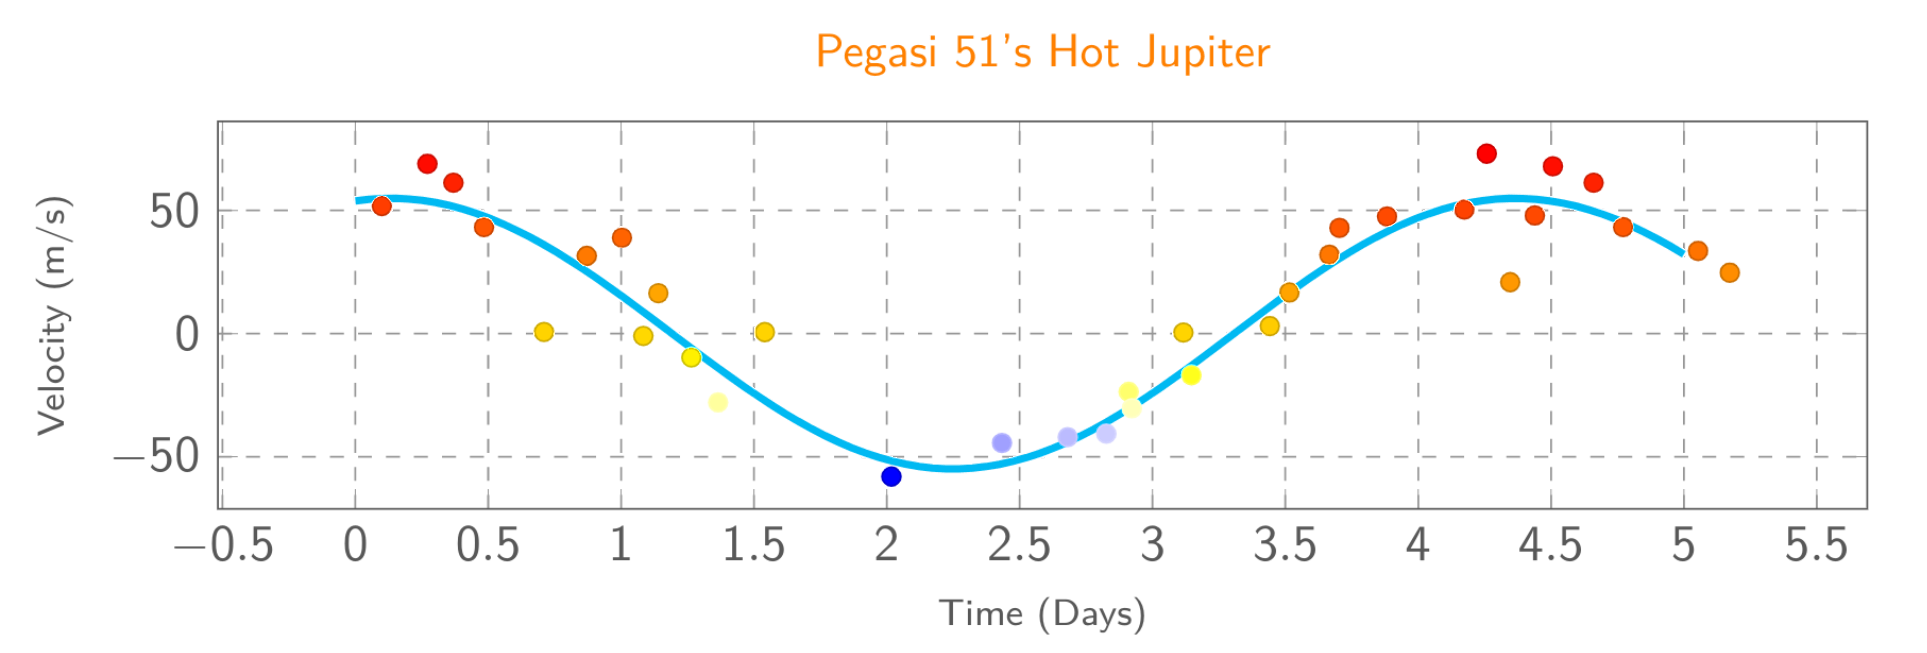
The Astrometric Method
Make extremely precise measurements of a star’s
location against its background stars
Need slightly ridiculous levels of precision to do well
More “obvious” planets would have longer orbits, and thus we would
need to observe longer to see their effects
These types of measurements are one of the main aims of the GAIA
mission
Hangs out at the \(L_2\) Lagrange
point (same as Webb!)
Needs to know its exact position to within 150 m
every day!
Wiggle Wiggle
Often, we are not viewing the plane of an exoplanetary system
directly from the top
How we see this “wiggle” from Earth depends on how the planets orbit
is oriented relative to us
A perfectly “top down” view would have us seeing the planet making
little circles
A perfectly “side” view would have us seeing the planet move towards
us and away from us on the left and right sides
In general, it is easier for us to detect and measure the forwards
and backwards motion, but instruments like Gaia can detect the
tinier circular motion for some systems
Doppler Wiggle
The idea then is to monitor the dominant frequency of light emitted
over a period of time
Should result in a sinusoidal curve as the star wiggles
The amount of wiggle will depend on both the mass
of the orbiting planet and our perspective