---
title: "Non-Uniform Observations and Lomb-Scargle"
author: Jed Rembold
date: February 25, 2025
slideNumber: true
theme: tokyo-night-light
highlightjs-theme: tokyo-night-light
width: 1920
height: 1080
transition: slide
p5js: true
---
## Announcements
- Be working on HW3!
- Don't forget the check-in form this weekend!
- Quiz scores are finished, I just need to get them in the gradebook
- No class on Thursday! I am in Pittsburgh.
- If you have questions over the next 5 days, message me on Discord. I'll be much slower in responding that per usual, but I'll make sure I get to them each evening
## Recap
- Looking at discrete Fourier transforms brings extra effects:
- The overall observing window controls the broadness of the found peaks
- Smaller windows make for broader peaks
- The sampling rate determines how often we get aliased peaks
- Finer sampling results in further spaced aliases
- It is worth noting that, for a general Discrete Fourier Transform power spectrum, the max frequency reported is before the aliasing would start
- When using pure Fourier Transform approaches, you won't need to worry about aliases
## Discussing Today
- What is the limit of frequencies we can detect?
- What happens when observations are not consistently spaced?
- The Lomb-Scargle Periodogram
- Period-Folding
- Exoplanet Hunting:
- Astrometric Method
- Doppler Method
# Taking it to the Limit
## The Nyquist Limit
- Note that if the window of observations gets too small, or the time between observations too large, our Fourier Transform peaks will begin to overlap!
- In this case not all of the frequency information can be recovered
- This is called the Nyquist Limit, and occurs at a frequency of half the sampling frequency
- The FFT algorithm generally measures frequencies _up to_ but not beyond this point, so you shouldn't see aliases in your results, but your results might not capture what you were hoping to see.
## Nyquist Visual

# Variety is the Spice of Life
## Non-uniform Observations
::::::cols
::::col
- We don't always get to have perfectly uniform observations!
- Non-uniform observations add what will seem to be "noise" to the FFT
- Effects of small segments of periodicity between various observations
::::
::::col

::::
::::::
## Non-uniform FFT
- In practice, computing a DFT using a computational FFT can be problematic, since the returned frequencies are computed assuming a uniform spacing
- The `d` in `fftfreq(n, d)`
- You could super-sample the observations, adding an evenly spaced grid with 0's wherever no data exists
- Still might be difficult to get an evenly spaced grid that exactly contains all observations
- A better option though is to shift to a slightly different estimator: the _Lomb-Scargle Periodogram_
# Lomb-Scargle Methods
## Lomb-Scargle
- Lomb and Scargle considered a more generalized form of the periodogram, with added functions $A$, $B$, and $\tau$, and then showed that you could choose those functions such that:
- The periodogram reduces to the classical form for evenly spaced observations
- The periodogram's statistics are analytically computable
- The periodogram is insensitive to global time-shifts in the data
- The same basic insights we had with the classic periodogram will still hold qualitatively with Lomb-Scargle, even if not exactly the same quantitatively
- The real price you pay vs the classic periodogram is that you have to deal with aliases
## Lomb-Scargle in Python
:::{style='font-size:.9em'}
- Scipy's Signals library provides an implementation of the Lomb-Scargle periodogram
- `from scipy.signal import lombscargle`
- Works with **angular frequencies**:
$$\text{Angular frequency } = \omega = \frac{2\pi}{T} = 2\pi f $$
- You need to provide 3 arrays:
- The sequences of observation times
- The observed signal
- The desired angular frequencies to compute the periodogram over
```python
power = lombscargle(ts, signal, afreqs, floating_mean=True)
```
:::
## Lomb-Scargle in R
- Install the "lomb" library to get access to nice Lomb-Scargle functions in R
- `install.packages("lomb")`
- Works with normal frequencies!
- You can actually have it work directly in terms of period as well if you like
- Need to provide:
- Observation times
- Observed signals
- Starting and stopping frequency/period values
```R
model <- lsp(df, from=0.001, to=1)
```
## Demo
- The file [here](../demos/lombscargle_demo.csv) is of a simple sine wave with noise added.
- It has been sampled randomly to create a non-uniform sample rate.
- Our goal is to use Lomb-Scargle to extract the period.
## Activity!
- Provided [here](../demos/lombscargle_activity.csv) is a noisy signal that is a combination of several signals with differing periods
- Determine the period of all underlying signals
- How did you parse the different aliases?
# Forging a Signal
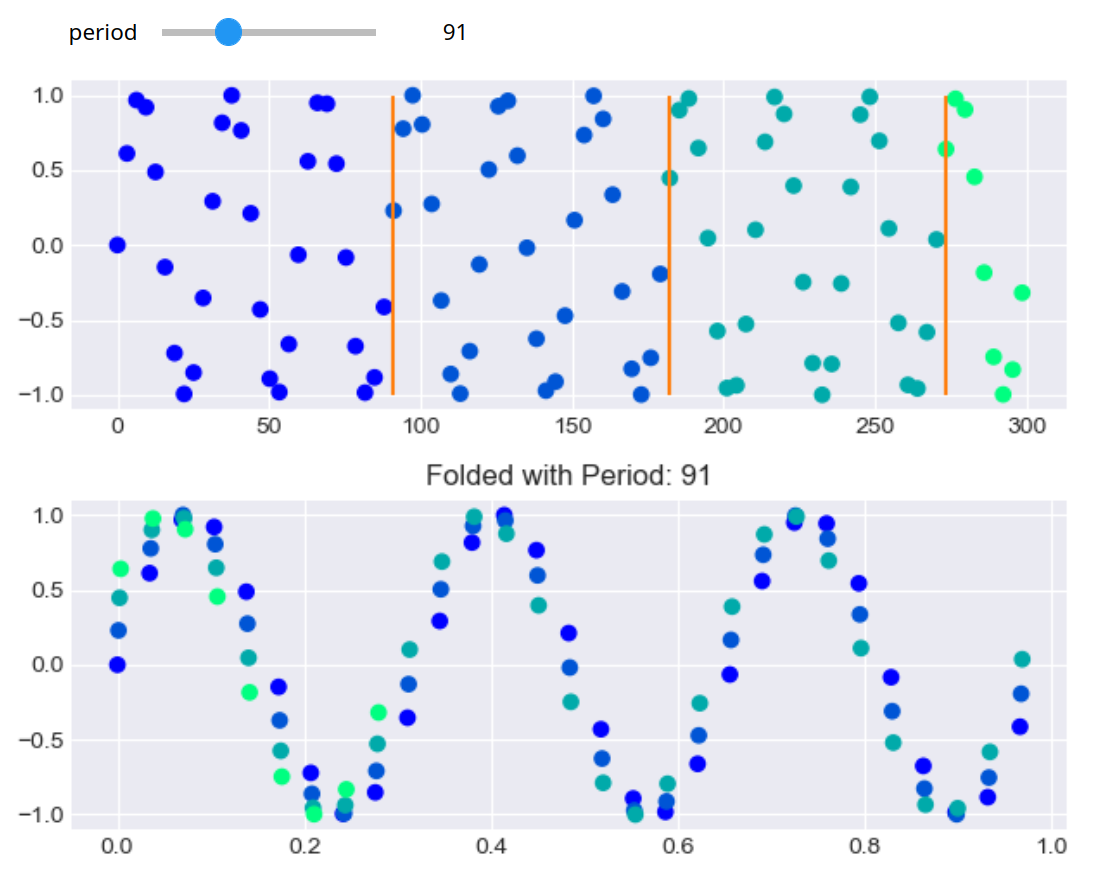
## Phase Folding
- Periodograms are excellent for determining the frequency / period of hidden signals, but they don't let you _see_ those signals
- Often times want to go one step further and use the found period to "fold" the signal over again on itself
- Snippets of the signal that may have been captured by very different observations get properly aligned or stacked
- The _phase_ of the signal describes how far is signal is through its period
- Calculating phase is a classic example of using the modulo operator:
```python
phase = times % period
normalize_phase = phase / period
```
## Visual Phase Folding
::::::{.cols style='align-items: flex-start'}
::::col
- Often times you'll see the phase scaled by the period, so that it starts at 0 and ends at 1
- Be careful! Folding at integer multiples of the true period may _look_ clean, but will contain more than a single oscillation
- [Notebook Demonstration](../demos/PhaseFoldingDemo.ipynb) (requires the ipywidgets package)
::::
::::col
::::
::::::
# The Exoplanet Quest
## Why are planets so hard to see?
::::::cols
::::col
- _Exoplanets_ are planets orbiting stars that are not our own Sun
- Commonly far too tiny to be observed directly
- Recall we can't even resolve most **stars**
- We must then rely on other, more subtle measures
::::
::::col
\begin{tikzpicture}%%width=100%
[scale=.9, transform shape]
\fill[inner color=yellow, outer color=orange] (0,0) circle (3.5cm);
\fill[black] (-1,0) circle (3.5mm) node[above,yshift=3mm] {Jupiter};
\fill[black] (1,0) circle (0.3mm) node[above, yshift=1mm] {Earth};
\end{tikzpicture}
::::
::::::
## Gravity Tugs!
::::::cols
::::col
{width=70%}
::::
::::col
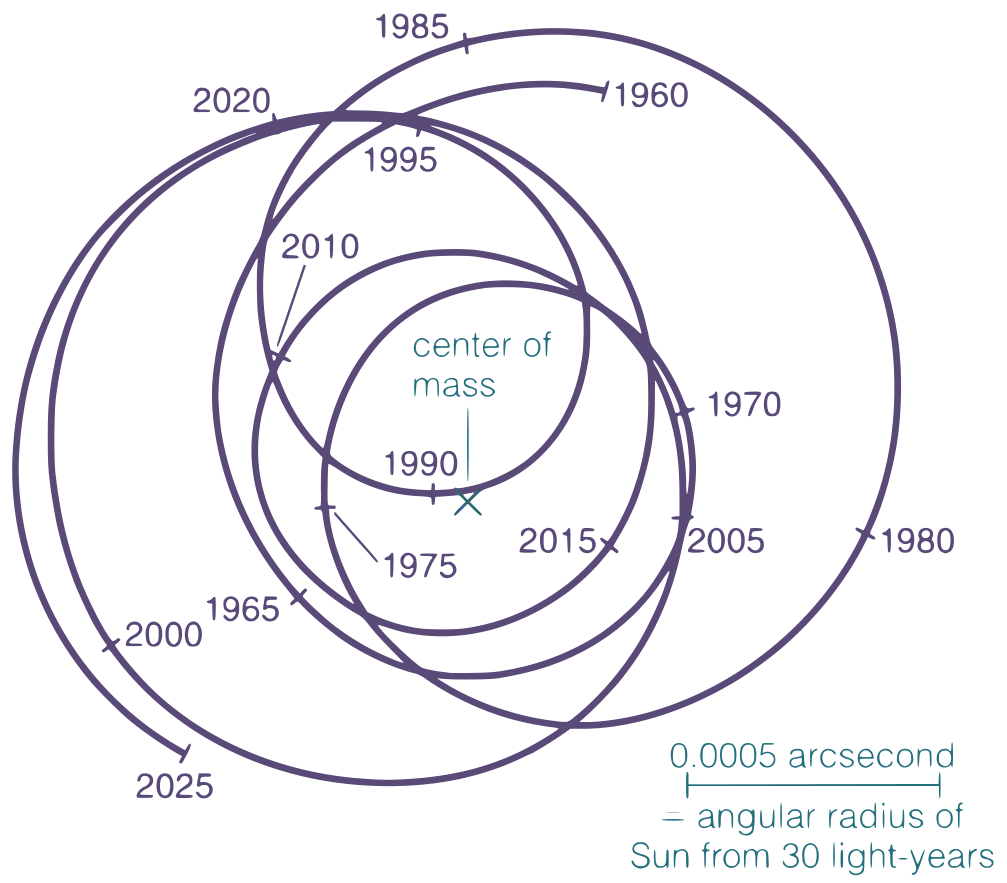
- Planets and their host stars actually orbit the _center of mass_ between the planet and its star
- In most system, this point might still be inside the radius of the star, but it is not at the **center** of the star
- As the star oscillates then, you get a bit of "wobble"
- Most pronounced for massive planets far from their host star
::::
::::::
## The Astrometric Method
- Make **extremely** precise measurements of a star's location against its background stars
- Need slightly ridiculous levels of precision to do well
- More "obvious" planets would have longer orbits, and thus we would need to observe longer to see their effects
- These types of measurements are one of the main aims of the [GAIA](https://www.esa.int/Science_Exploration/Space_Science/Gaia) mission
- Hangs out at the $L_2$ Lagrange point (same as Webb!)
- Needs to know its exact position **to within 150 m** every day!
## {data-background-image=../images/gaia_skymap_dr3.png}
## Wiggle Wiggle
- Often, we are not viewing the plane of an exoplanetary system directly from the top
- How we see this "wiggle" from Earth depends on how the planets orbit is oriented relative to us
- A perfectly "top down" view would have us seeing the planet making little circles
- A perfectly "side" view would have us seeing the planet move towards us and away from us on the left and right sides
- In general, it is easier for us to detect and measure the forwards and backwards motion, but instruments like Gaia _can_ detect the tinier circular motion for some systems
## Doppler Wiggle
- The idea then is to monitor the dominant frequency of light emitted over a period of time
- Should result in a sinusoidal curve as the star wiggles
- The amount of wiggle will depend on **both** the mass of the orbiting planet **and** our perspective
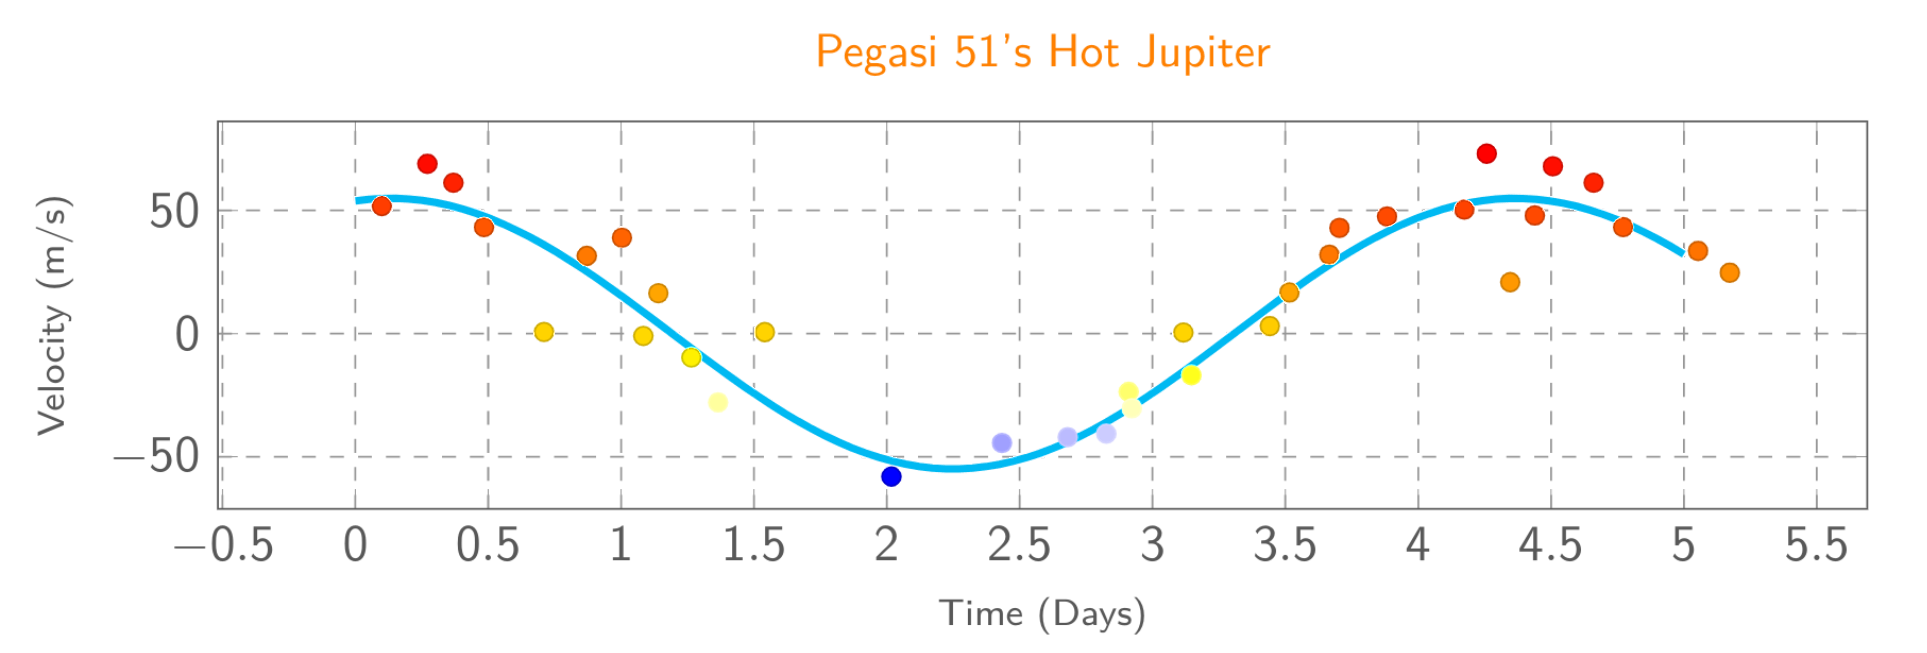
## Full Example