---
title: "The Milky Way"
author: Jed Rembold
date: March 05, 2024
slideNumber: true
theme: tokyo-night-light
highlightjs-theme: tokyo-night-light
width: 1920
height: 1080
transition: slide
p5js: true
---
## Announcements
- HW3 is technically due tonight!
- The debriefing form will open up at midnight and be available until Thursday night
- I realize I still have not gotten feedback to you on HW2. It is slow, but steady progress.
- I should have feedback to you in the next few days, and if that feedback causes you to want to revamp something in your HW3 submissions, you are allowed to do that without penalty **until the end of Saturday**.
- HW4 is coming out today!
- Partner meet-n-greet at the end of class today
## Recap
- Last class, we discussed several ways to help deal with noise in data
- Rolling averages
- Need to choose a window big enough to help with the noise, but small enough to not lose important resolution
- Rebinning
- Gets data onto a uniformly sampled grid
- Bins with no data can be handled in a variety of ways
- Including a NaN or NA value
- Inserting a 0
- Interpolating between the two nearest points
## Discussing Today
- Determining the structure of the Milky Way
- How to visualize something when you are inside it?
- Distances beyond parallax
- There is a limit to how precisely we can measure angles. So how do we go further?
# The Milky Way
## For the Lactose Tolerant
- To the Greeks appeared as a ribbon of milk across the sky
- Likely the source of its name
- Greek word for milk: galactose
- Galileo was the first to turn a telescope upon it:
:::quote
> The galaxy is, in fact, nothing but a collection of innumerable stars grouped together in clusters. Upon whatever part of it the telescope is directed, a vast crowd of stars is immediately presented to view. Many of them are rather large and quite bright, while the number of smaller ones is quite beyond calculation.
::::attribution
Galileo Galilei, The Starry Messanger (1610)
::::
:::
## Shaping a Picture
:::incremental
- Determining the size and shape of an object an observer is **within** can be tricky
- How could you try to estimate the size and shape of Collins, without leaving this room?
- We can't see through walls, so visible obstructions are a serious problem
- Exterior windows aren't really giving us a view of the building
- Probably on the edge then?
- Looking through the interior window:
- A portion of hallway and another classroom
:::
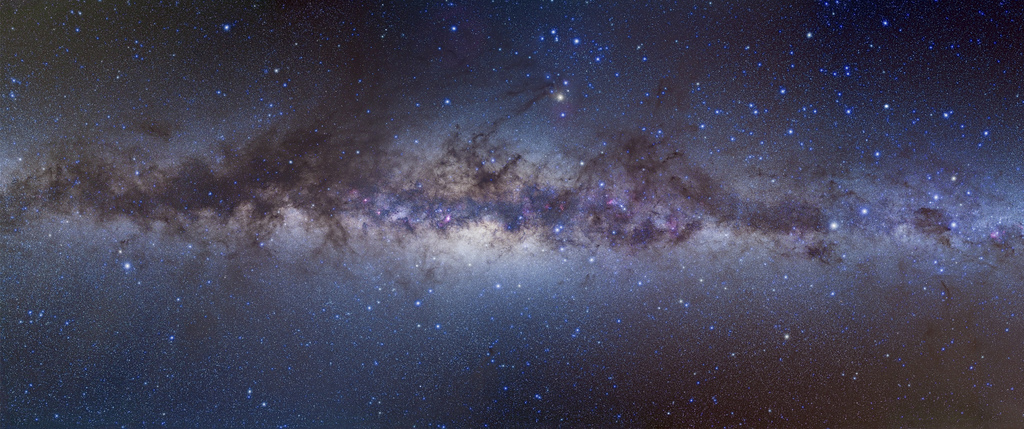
## Inspecting the Milky Way
## The Story of a Band
- If the Milky Way appears as a band across the sky, what does that tell us?
- We see way more stars looking in a specific direction than most others
- At 90 degrees to this direction, we see comparatively little
- At 180 degrees to this direction, we see more than at 90, but not nearly as much as the main direction
- Conclusions?
- The galaxy must be fairly flat
- We aren't on the very edge, but probably not in the middle either
## Measuring the Galaxy
::::::cols
::::col
- In the early 1800's, William and Caroline Herschel tried counting stars in different directions
- They concluded:
- The Milky Way was 5 times as wide as it was thick
- The Sun was approximately at the center
- There were several branches
::::
::::col
{width=100%}
::::
::::::
## What went wrong?
- Herschel had no way of knowing about how huge stellar distances were
- The first parallax measurements were gotten 15 years after his death
- Didn't realize it would be impossible to "see" to the edge of the galaxy
- Most stars would have been far too faint to see with his telescope
- Plus, much of the galaxy is obscured by opaque (to visible light) dust!
## Variations on the Theme
::::::cols
::::col
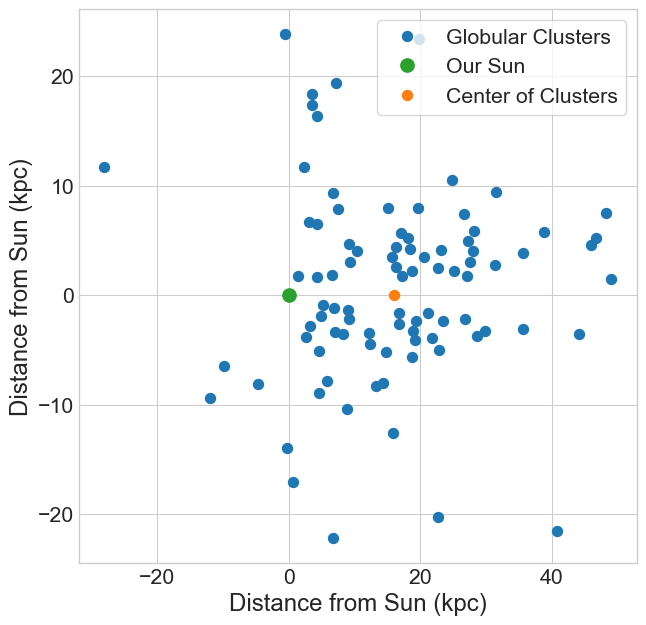
- Harlow Shapley attempted to do similarly, but instead used counted globular clusters
- Globular clusters live mostly above or below the dust band
- Contain many stars, and thus are easier to see and measure from a greater distance
- Findings:
- An approximately spherical distribution
- Definitely not centered on the Sun
::::
::::col
{width=100%}
::::
::::::
## Equatorial Conversions
- To do these sorts of calculations, it necessitates being able to convert between coordinate systems
- Observations most likely made in equatorial coordinates, which need to be converted to a Cartesian system
$$
\begin{aligned}
X &= R \cos(\delta)\cos(\alpha) \\
Y &= R \cos(\delta)\sin(\alpha) \\
Z &= R \sin(\delta)
\end{aligned}
$$
where $R$ is the distance away, $\delta$ the declination and $\alpha$ the right ascension.
- Note that these conversions place the XY plane as bisecting the equatorial sphere at the equator, which may not align with the plane of the galaxy
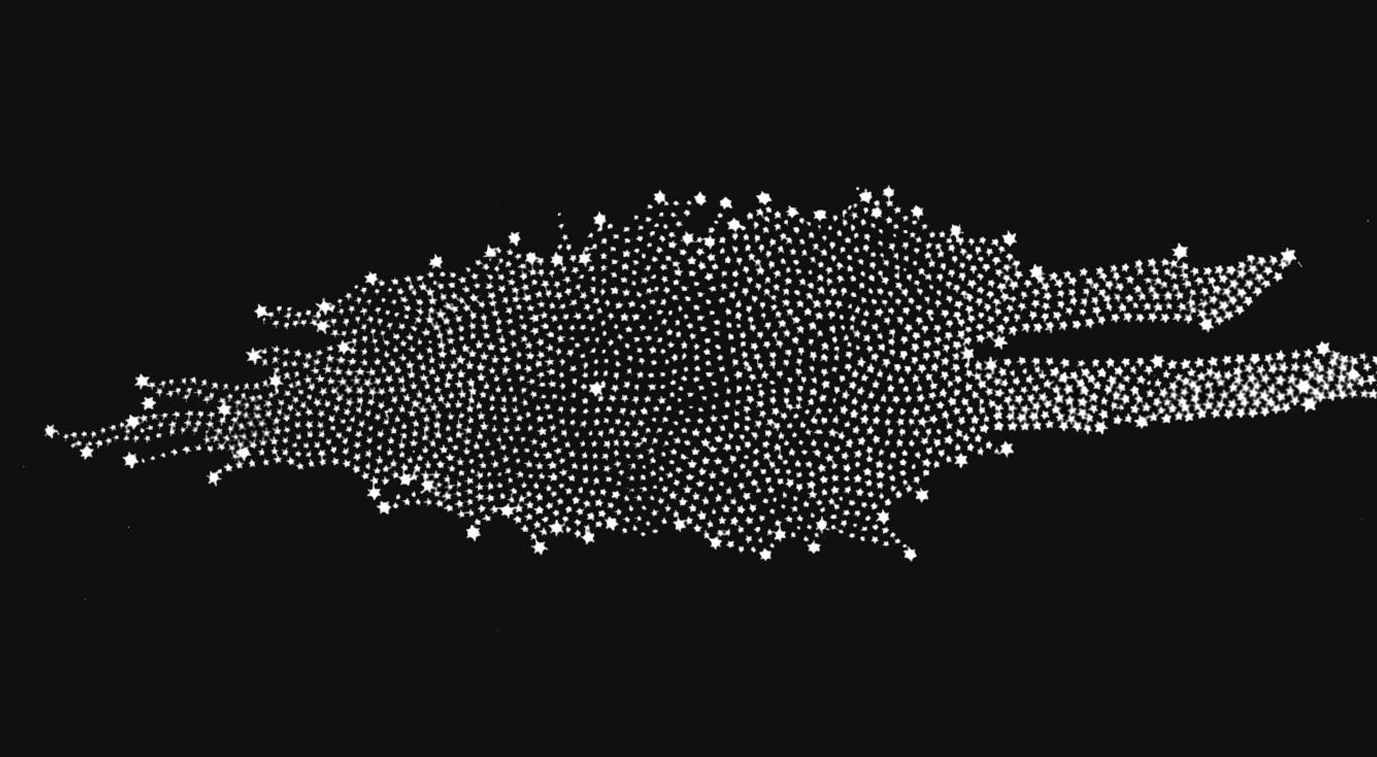
## Activity!
- The file [here](../demos/place_in_galaxy.csv) contains equatorial positions for 10k stars as seen from a simulated planet within the small elliptical galaxy
- You can assume the measurements are accurate enough to see and measure most of the star positions in the galaxy (or at least a representative sample)
- How far is the planet from which the observations were made from the center of the galaxy?
# Moving up the distance ladder
## Galactic Distances
- Most methods of determining shape rely heavily on accurate distance measurements
- But we can only measure parallax distances for the very nearest stars!
\begin{tikzpicture}%%width=60%
[scale=.75,transform shape]
\node[outer sep=0pt, inner sep=0pt] at (0,0) {\includegraphics[width=\textwidth]{~/Teaching/Data_in_Cosmos/Materials/Lectures/images/ch15_galaxy_side.jpg}};
\coordinate (star) at (-4,0);
\node[star, minimum size=3mm, inner color=yellow, outer color=orange, inner sep=0pt] at (star) {};
\draw[orange,dashed,very thick] (star) circle (1);
\end{tikzpicture}
## Moving up the Distance Ladder
- As we venture further, we need new ways to determine the distances to objects
- Some include:
- Main sequence fitting: comparing cluster HR diagrams to theoretical diagrams
- Variable Stars:
- RR Lyrae
- Cepheid Variables
## Cepheids
::::::cols
::::col
- Giant stars with very predictable pulsations in brightness
- Located along the _instability strip_ in an HR diagram
::::
::::col

::::
::::::
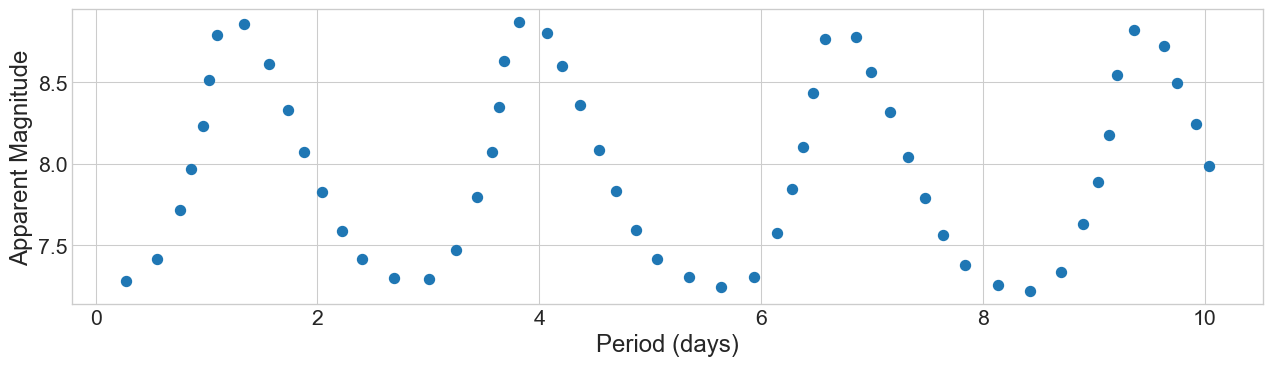
## Time = Power!
::::::cols
::::col
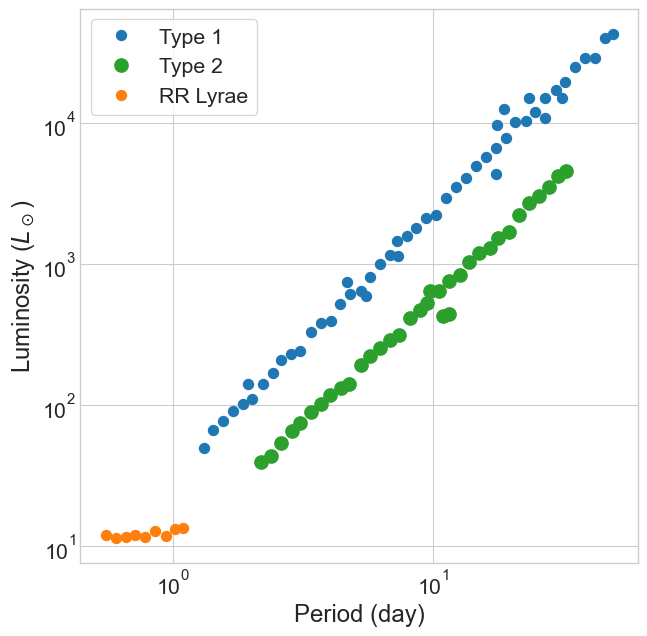
- In 1912 Henrietta Leavitt noticed that for Cepheid variables in the Small Magellanic Cloud:
- Those with higher luminosities
- Had longer pulsation periods
- This gives an easy way to determine luminosities!
- Which then gives us distances!
::::
::::col
{width=100%}
::::
::::::
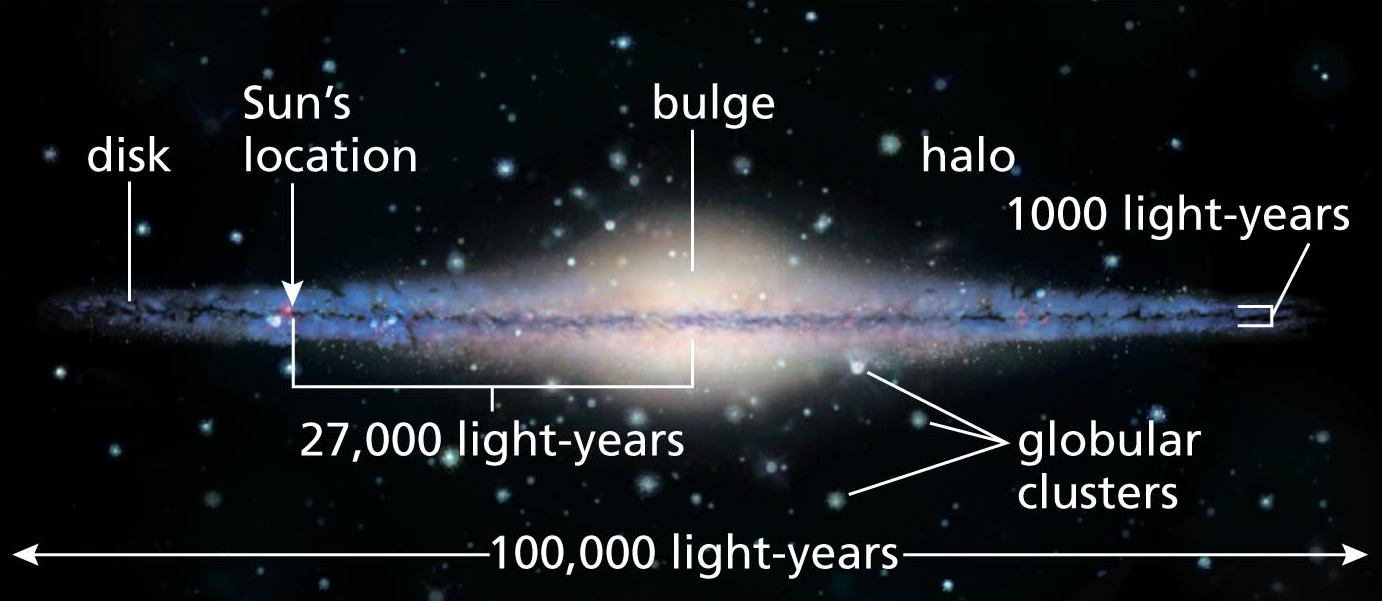
## Putting it Together
{width=100%}
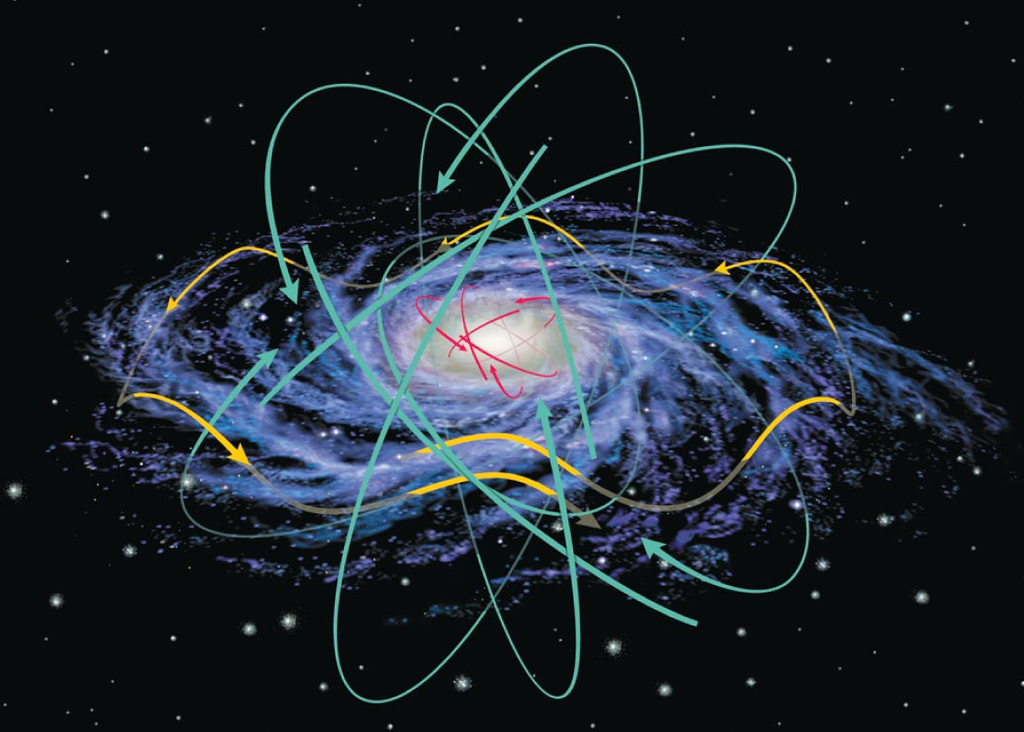
## Orbital Paths
{width=60%}
## HW4 Partners!
- You have the rest of class to meet up with your new partner for HW4 and start to plan ahead
::::::{.cols style='align-items: flex-start;'}
::::col
:::{.block name='Left Side'}
- Sadie and Evan
- Tegan and Sage
- Lucca and Luna
- Jared and Sergio
- Luca and Gabby
- Felicity and Ema
- Greg and Conor
:::
::::
::::col
:::{.block name='Right Side'}
- Aurora and Mamadou
- Sawyer and Elliott
- Izzy and Clay
- Oscar and Pearson
- Evyn and Maddie
- Salem and M
:::
::::
::::::