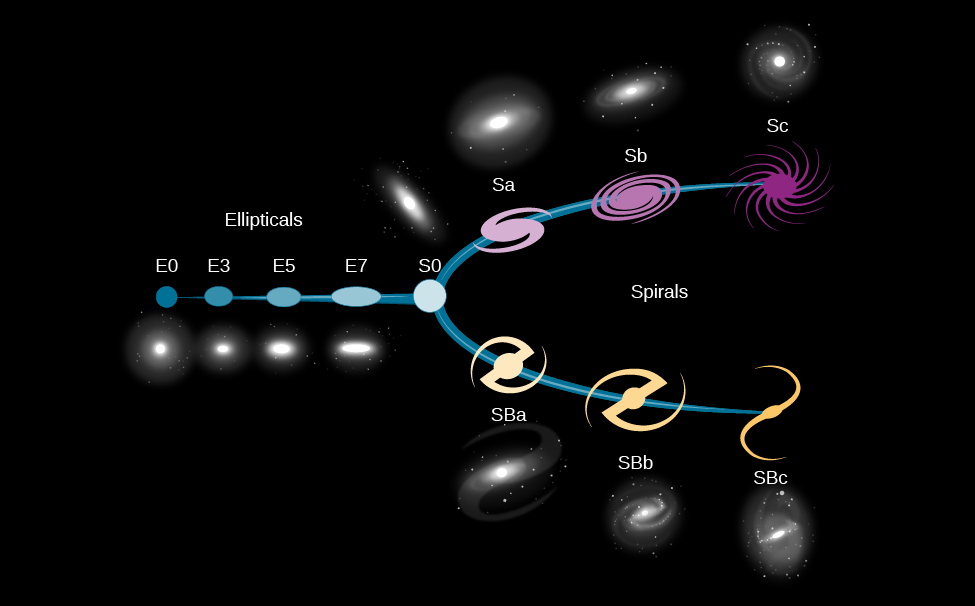
Hubble’s Fork
March 13, 2025
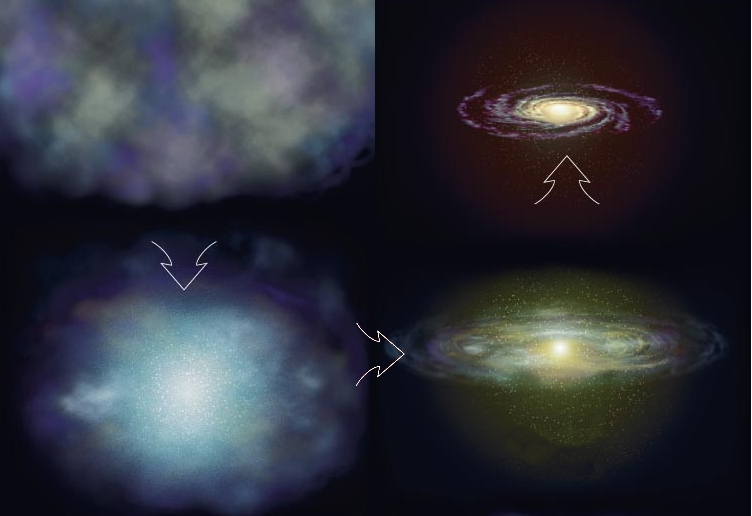
Galaxy Formation
- Any theory of galactic formation needs to predict these differences between halo and disk stars
- Current theory is that of a giant protogalactic cloud that
collapses under gravity
- Halo stars form as it collapses
- Then get left behind as angular momentum flattens the collapsing cloud
Our neighbors: The Magellanic Clouds
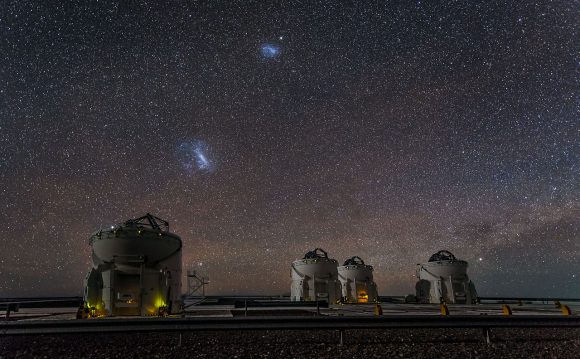
- Large and Small (about 160,000 and 200,000 lyrs away)
- Irregular dwarf galaxies, though they do have some spiral structure
- Both orbit the Milky Way (or do they?!)
- Only visible in the Southern hemisphere
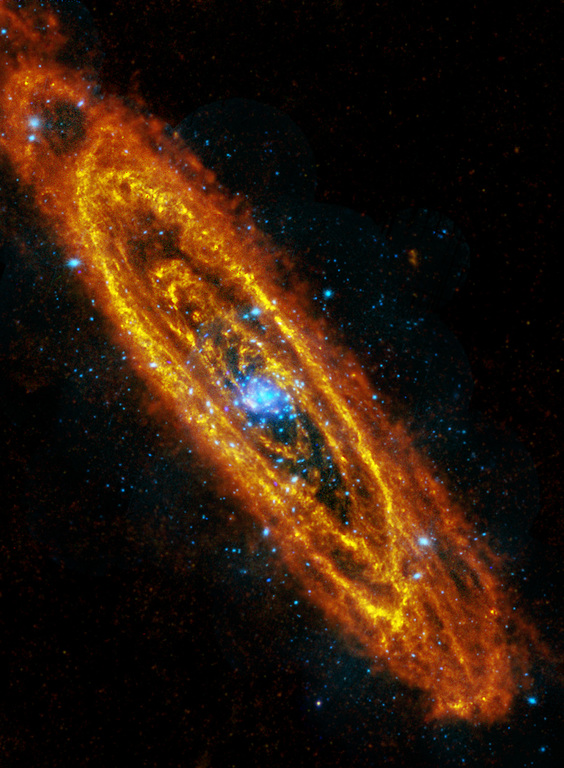
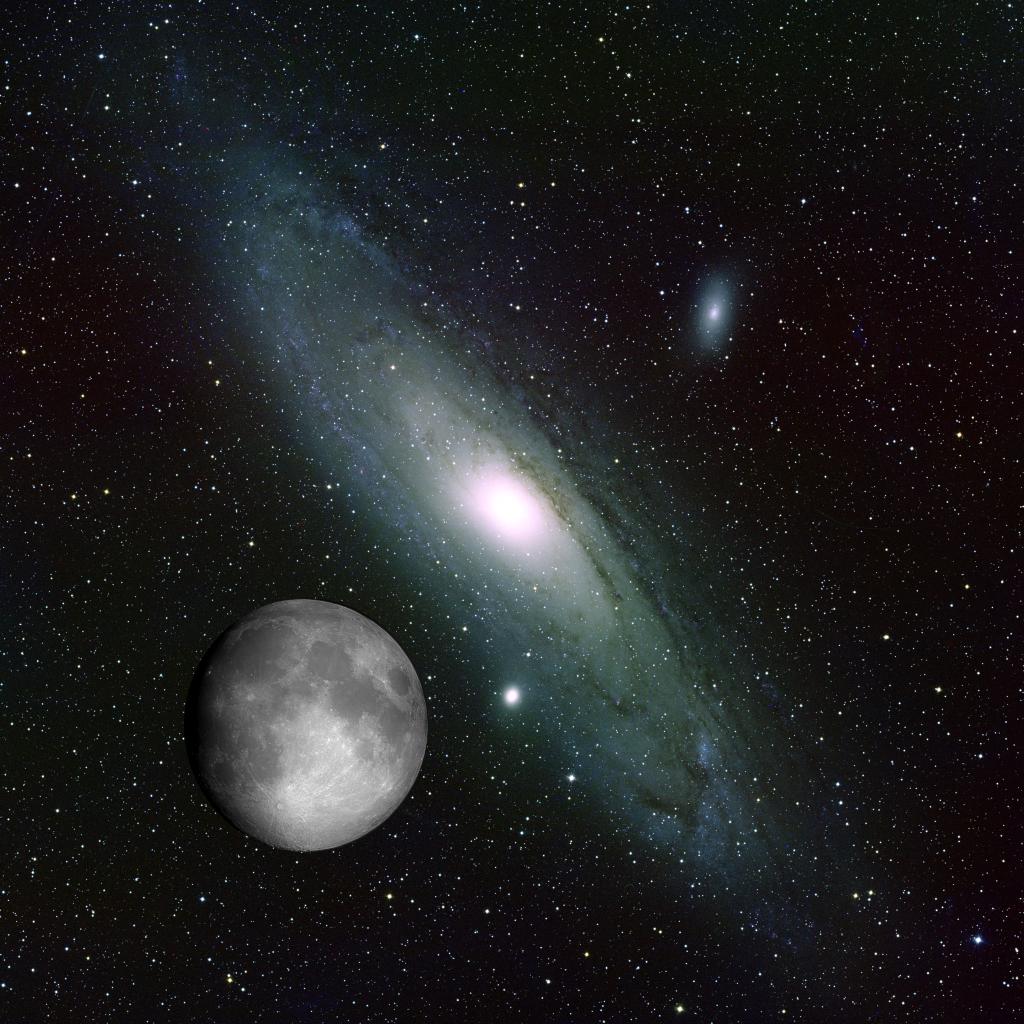
Our neighbors: Andromeda Galaxy
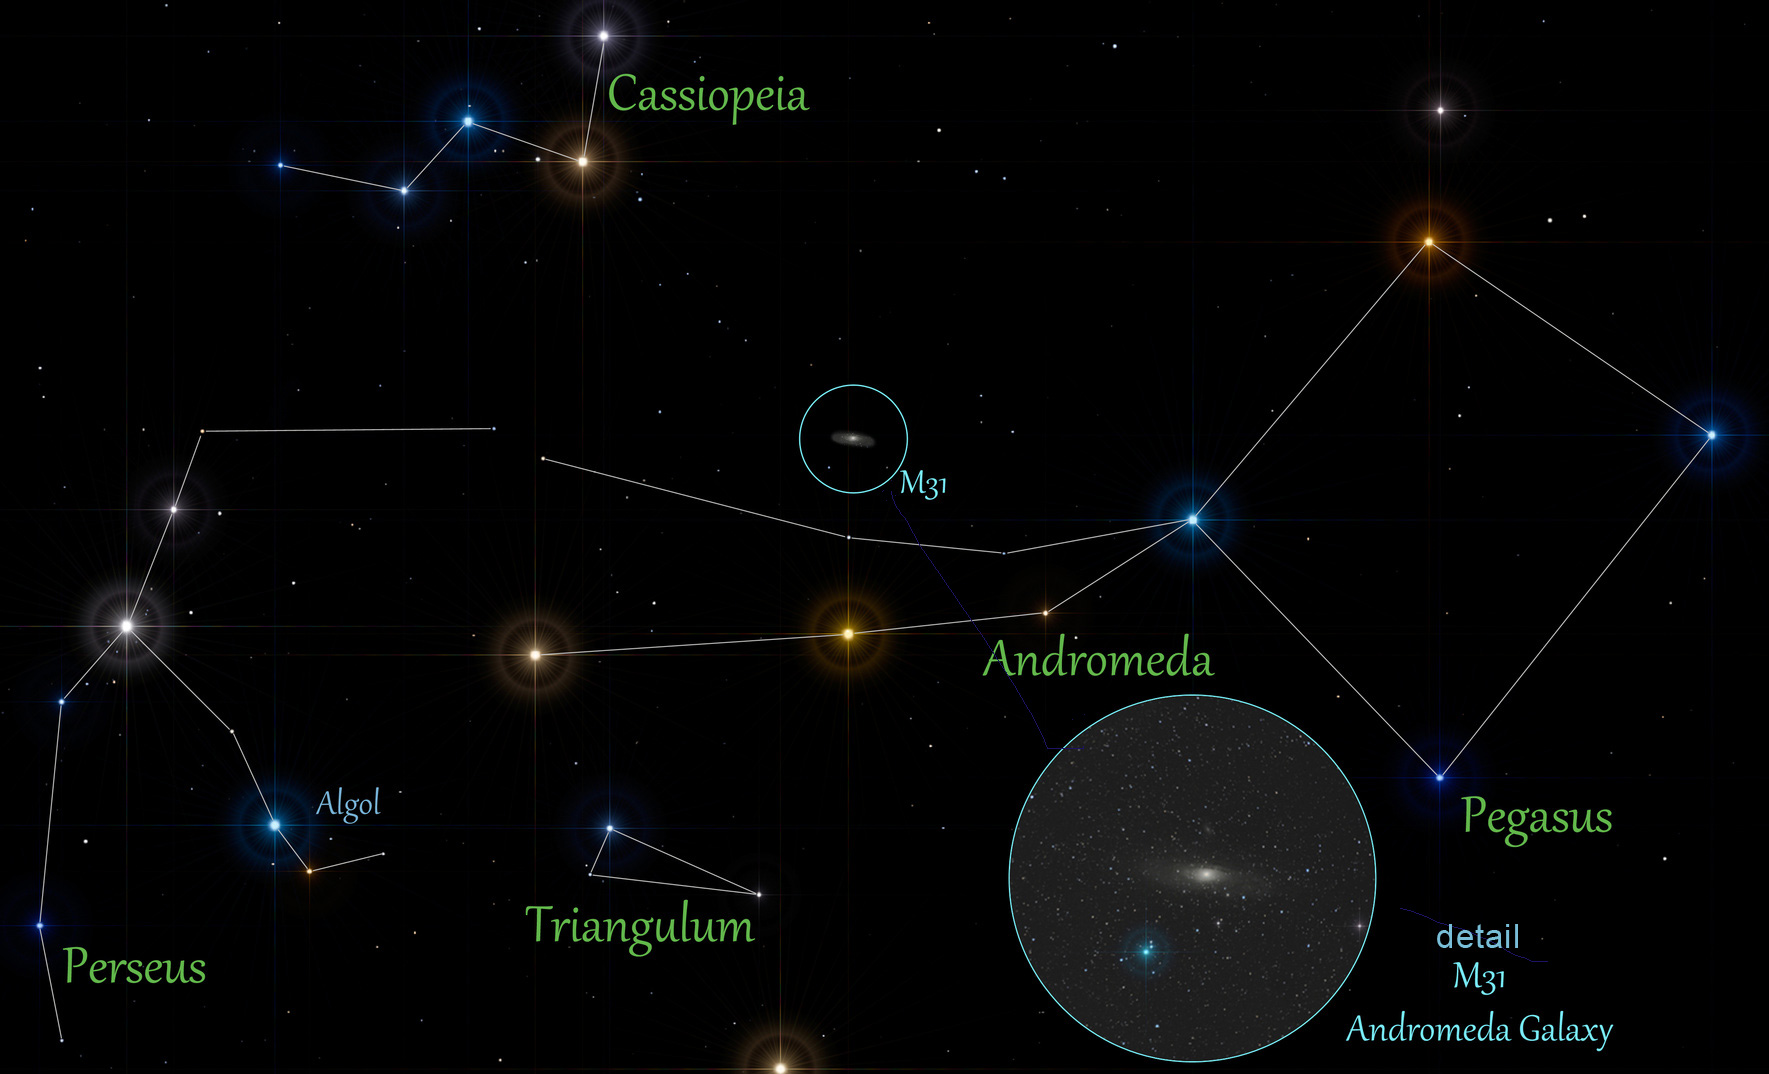
Our neighbors: Andromeda Galaxy
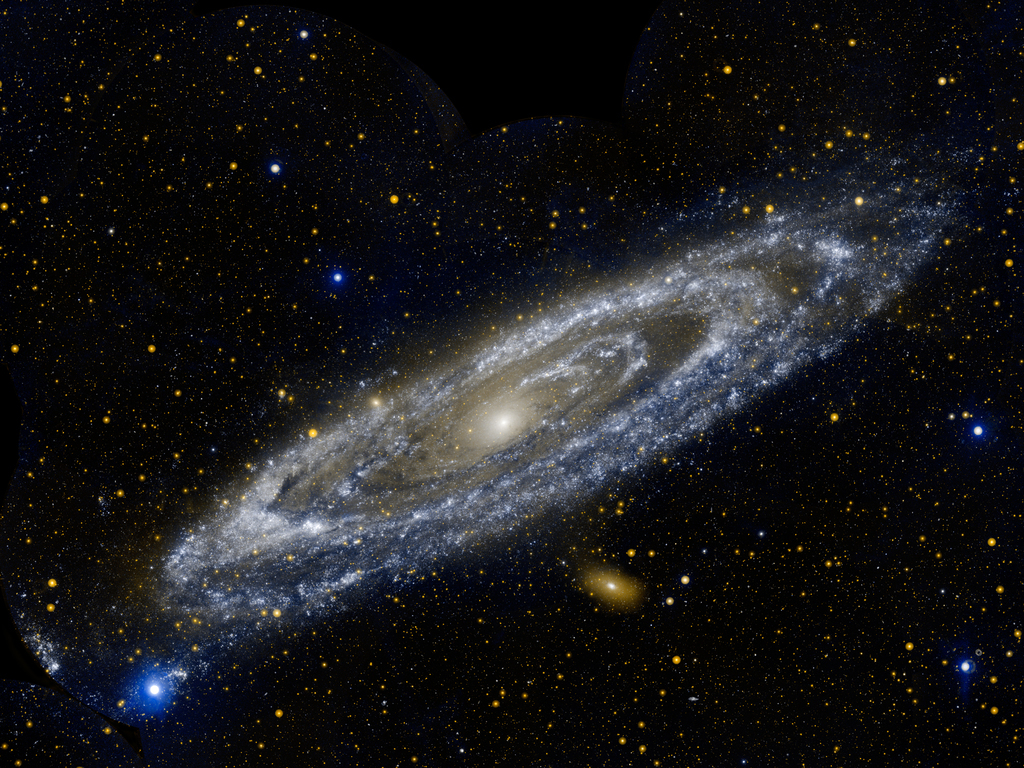
Our neighbors: Andromeda Galaxy
Galactic Flavors
- Looking beyond our neighbors, all galaxies tend to come in one of
three main types:
- Spiral
- Elliptical
- Irregular
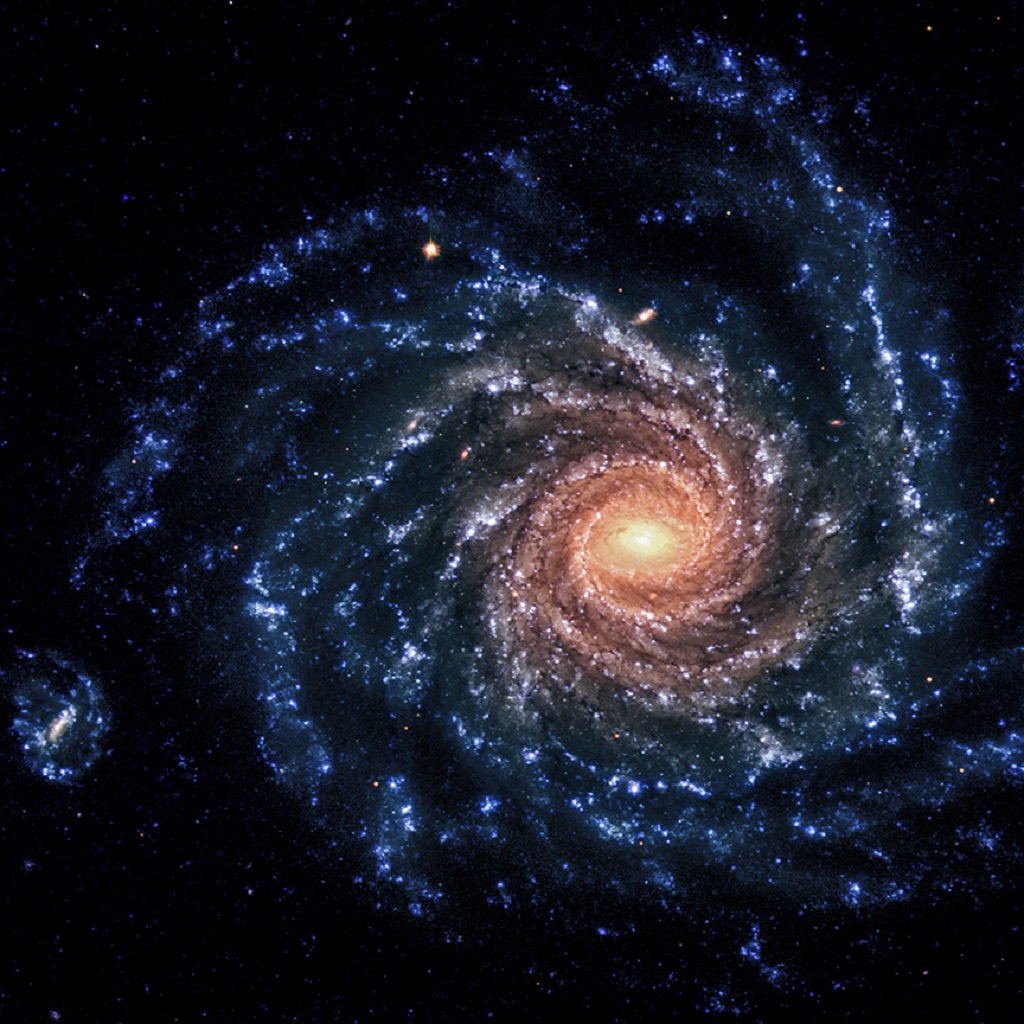
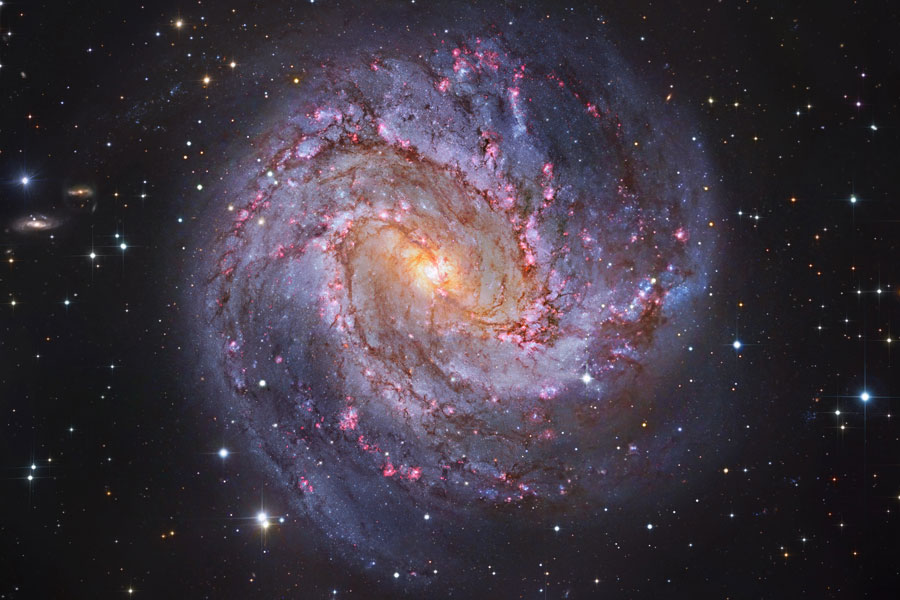
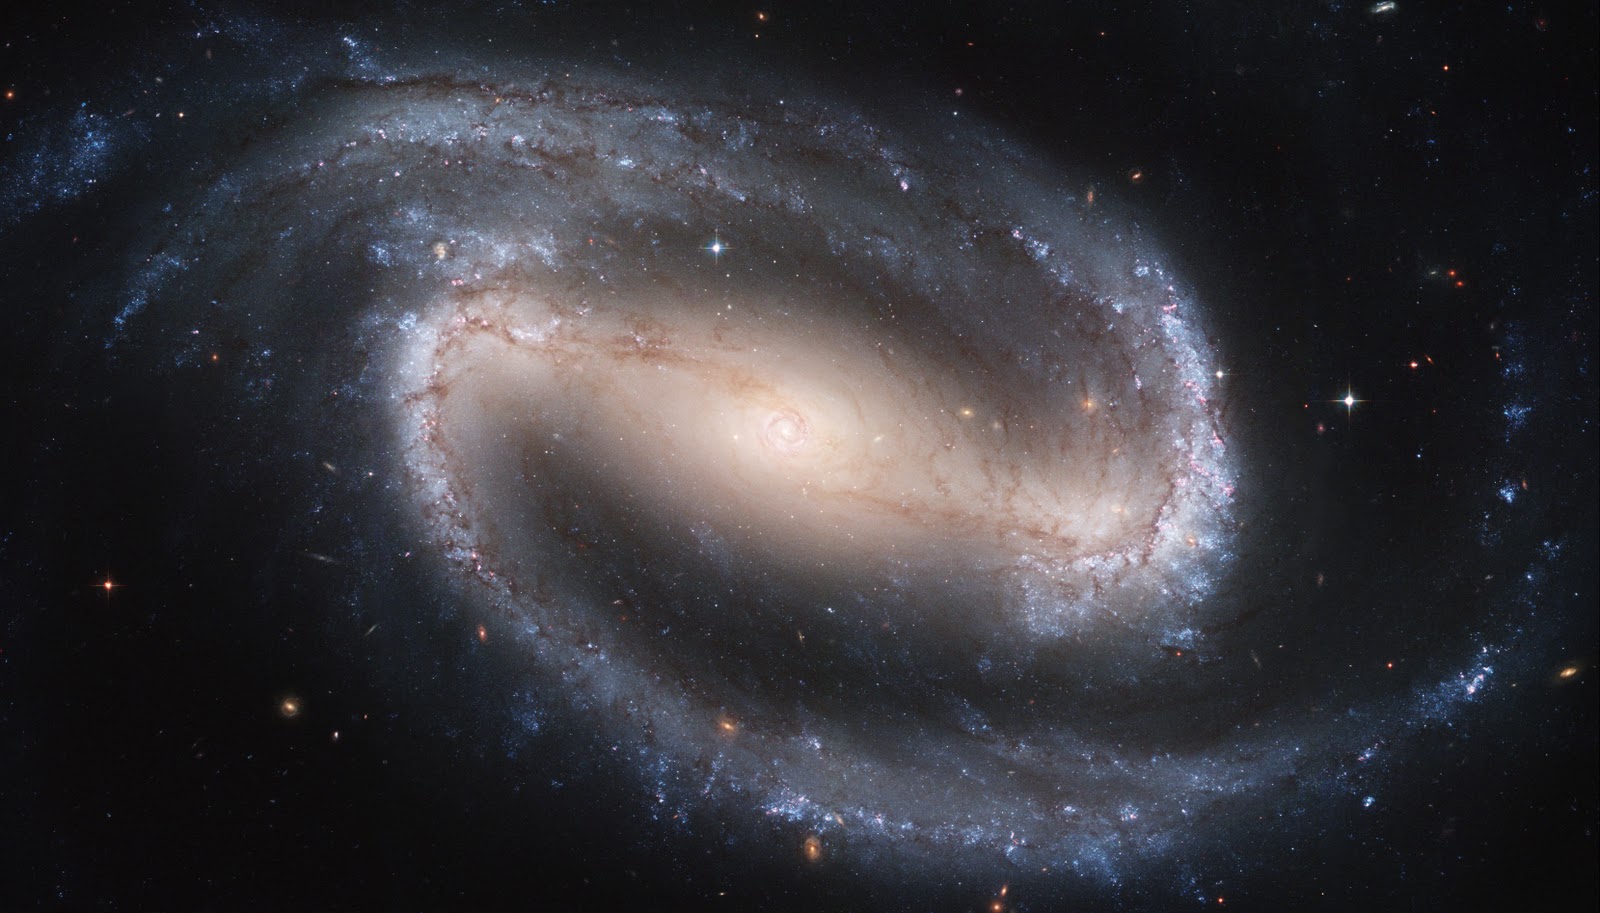
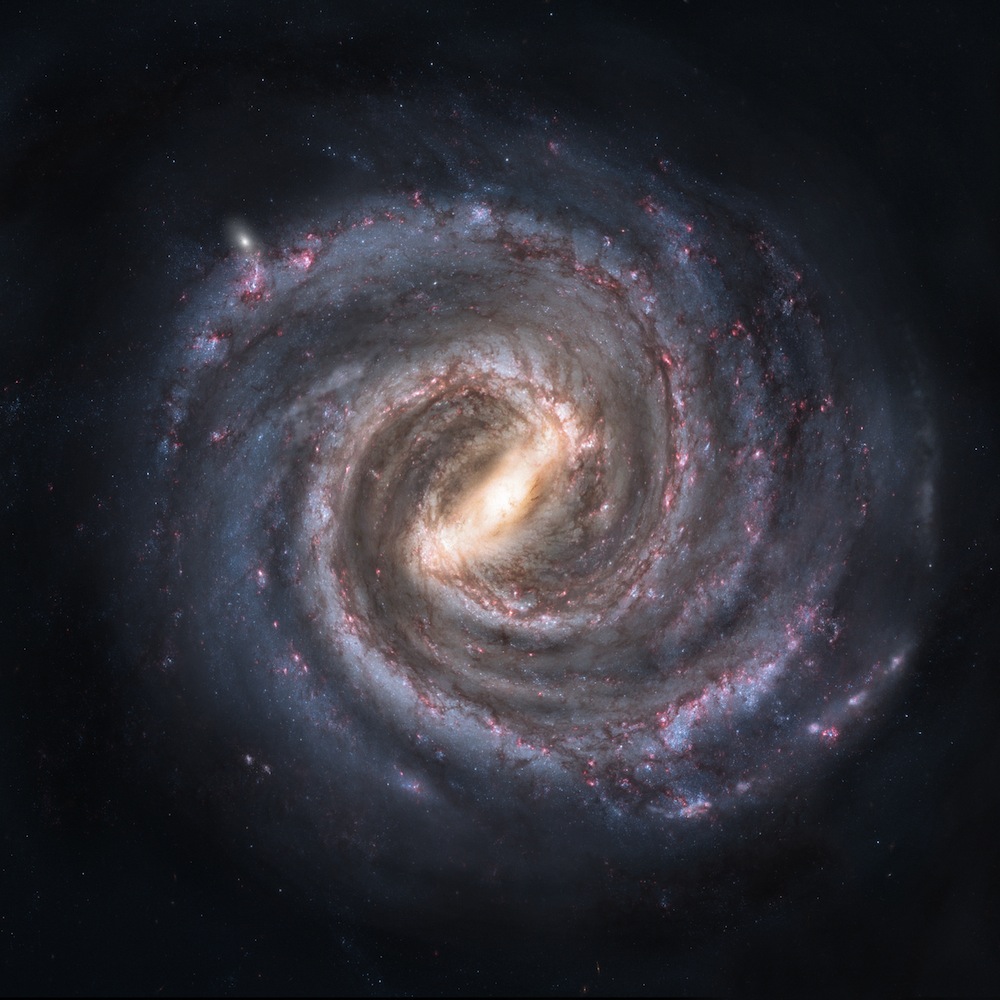
Spiral Galaxies
- Many of the same characteristics of the Milky Way
- Spiral disk, bulge, halo, etc.
- Can come in normal or “barred” varieties
- Spiral arms can be wrapped to varying degrees
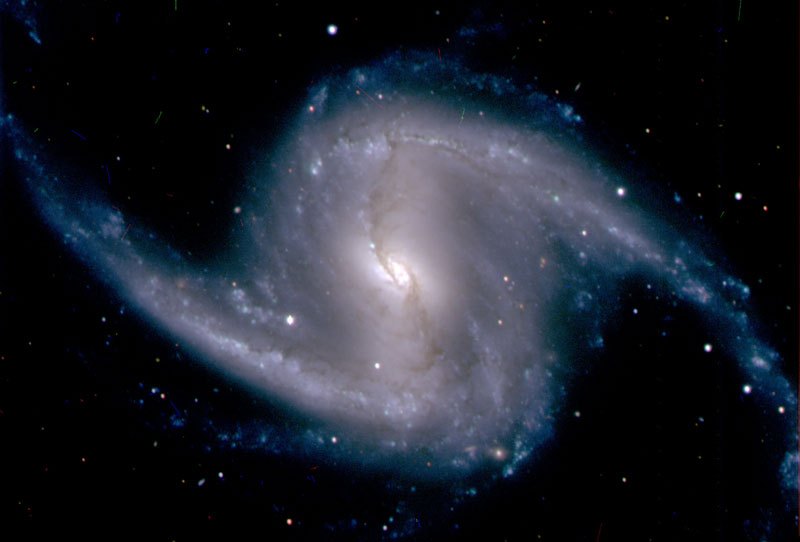
Spiral Arms
- Blue regions indicate star forming regions
- Galaxy rotates at same speed, so inner regions have shorter periods
- If arms moved with the stars, they would get all wound up!
- Spiral density waves:
- Pinches everything together in that region
- Doesn’t effect normal stars much
- Help molecular clouds collapse to start star formation
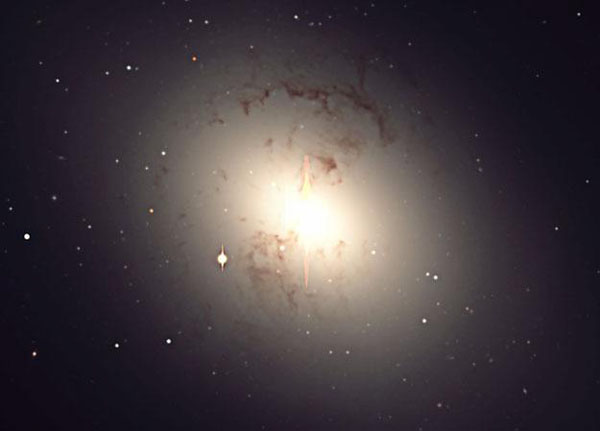
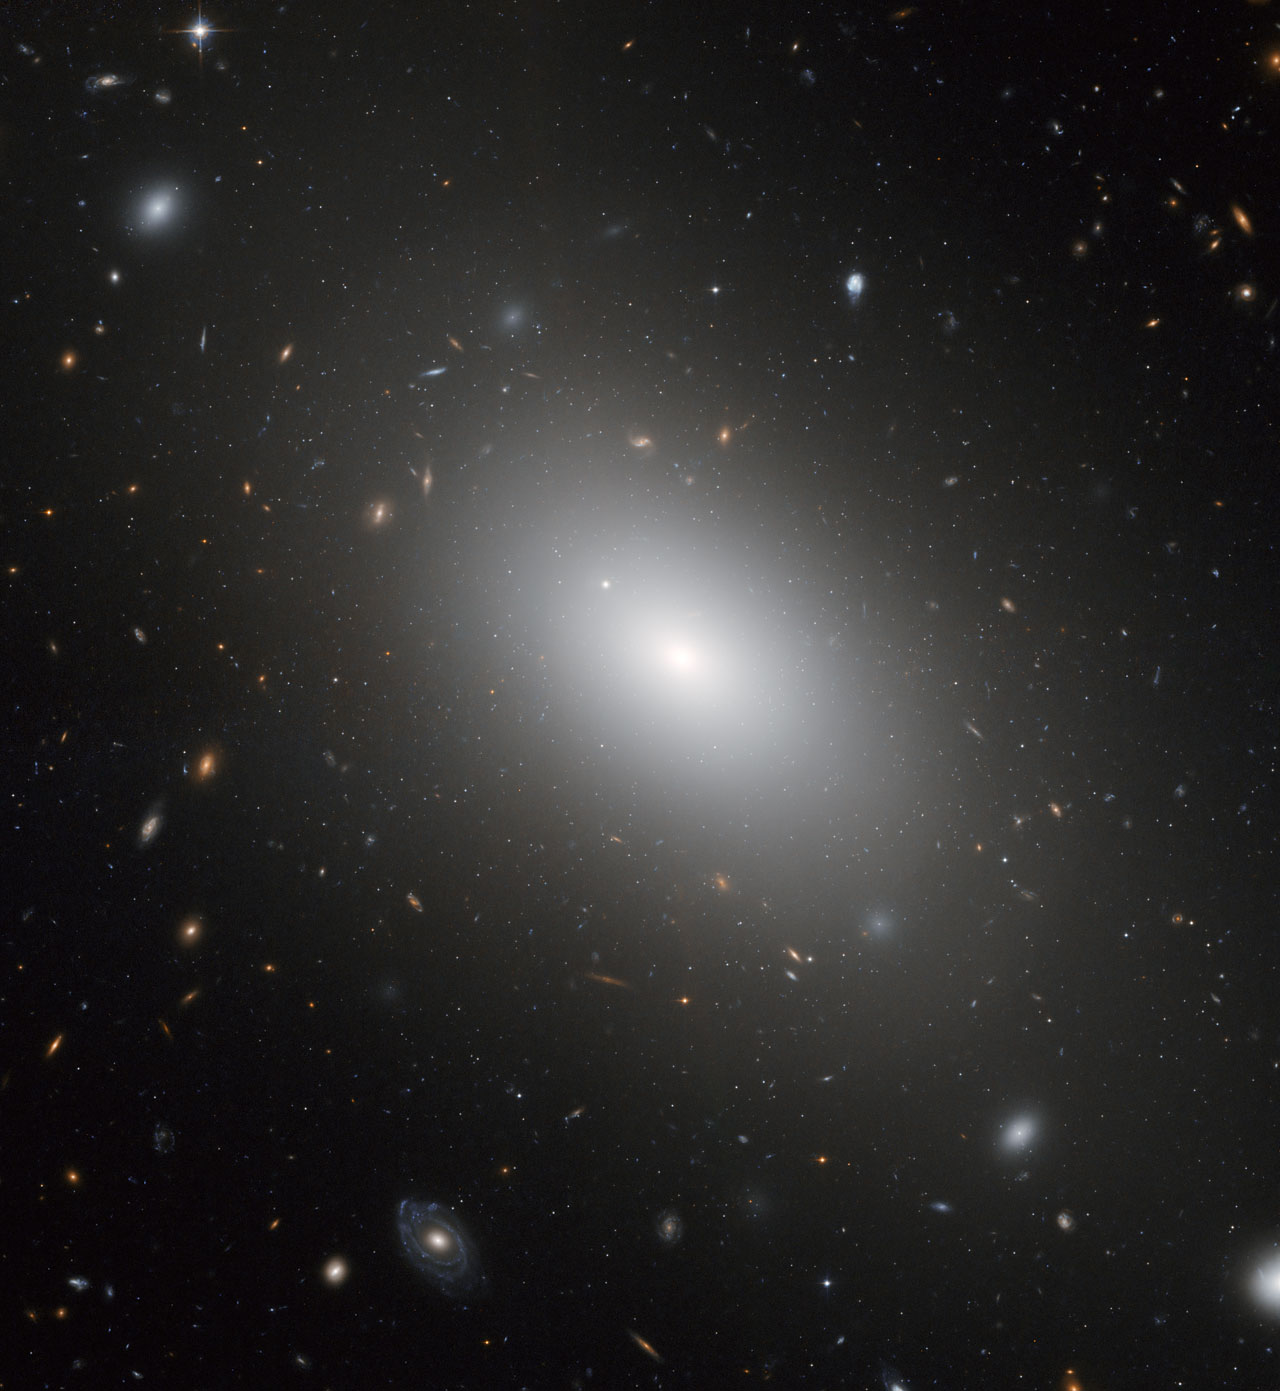
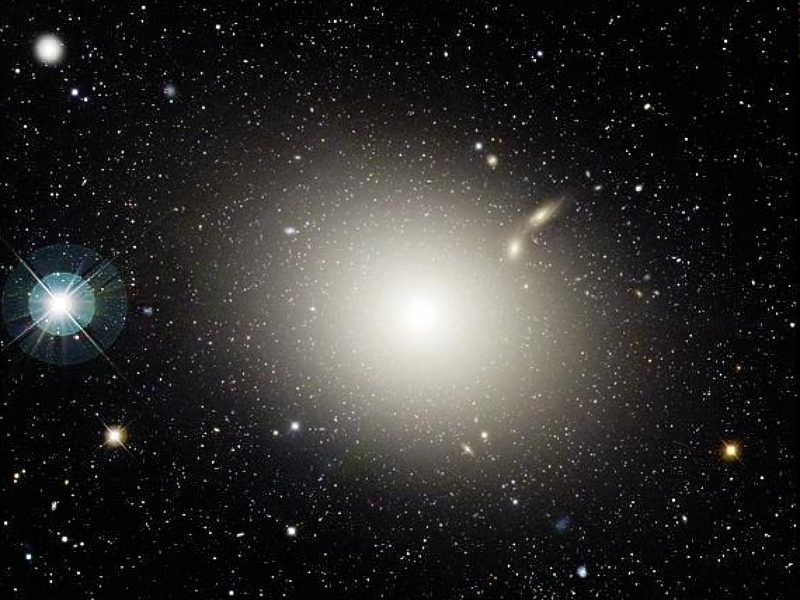
Elliptical Galaxies
- Differ from spirals in important ways:
- Have no disk
- Rotate more slowly
- Contain very little gas or dust
- Contain mainly old stars
- Huge range of sizes:
- 0.0001-100 times the MW size
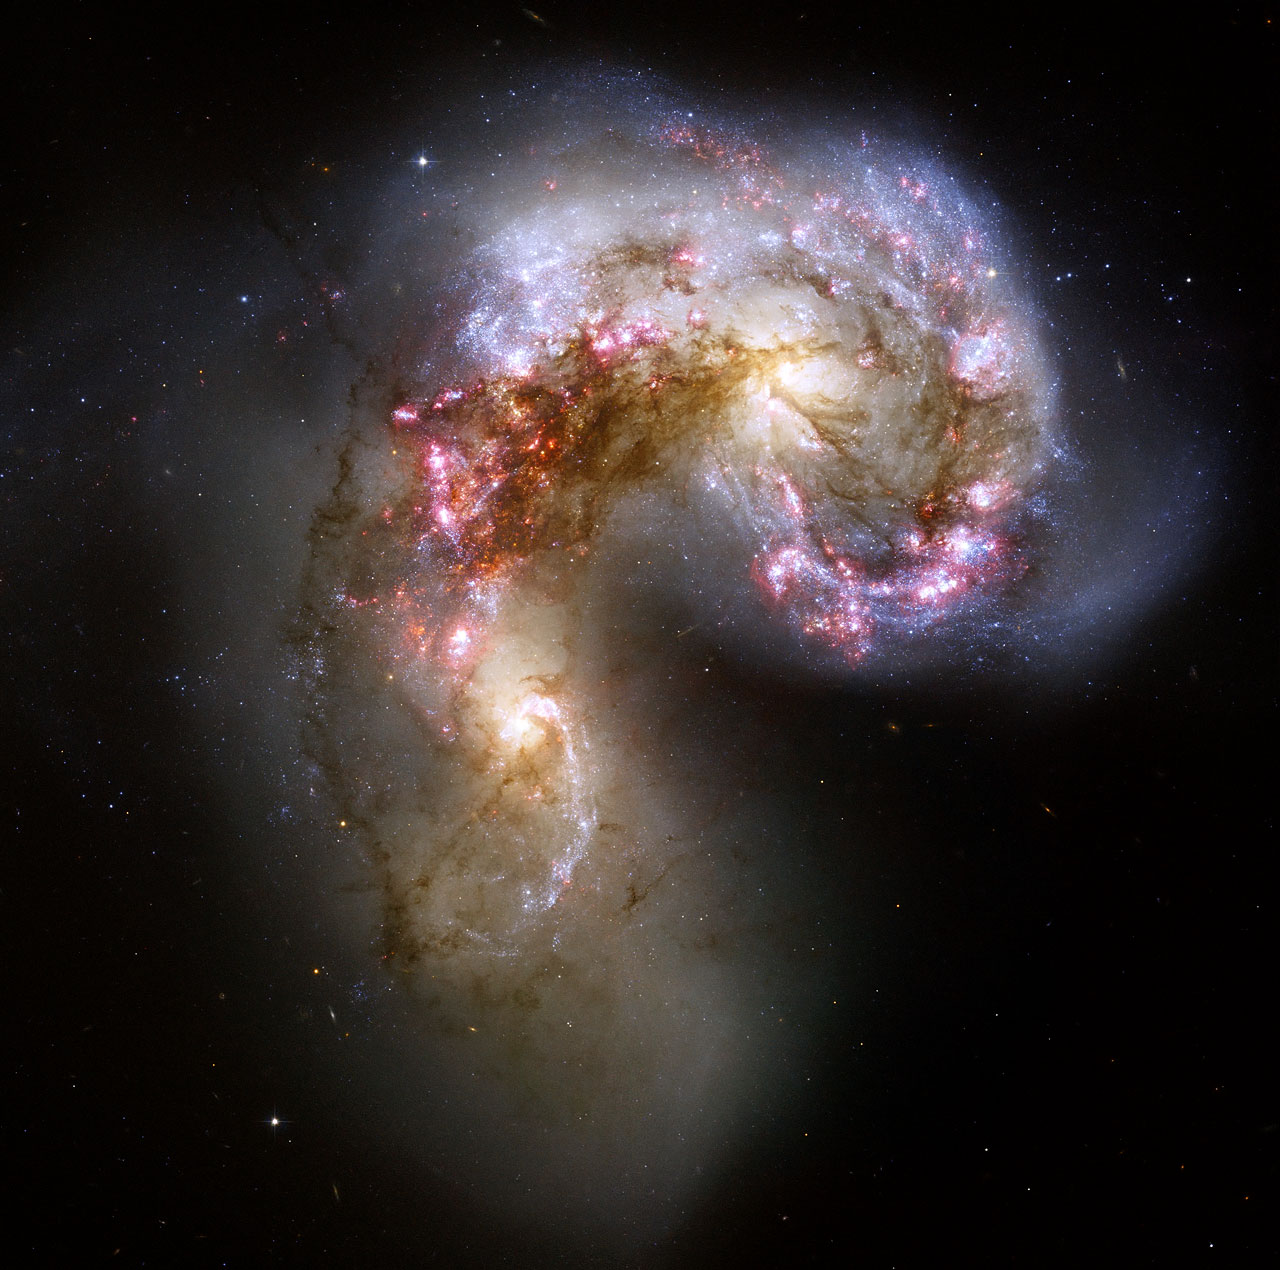
Irregular Galaxies
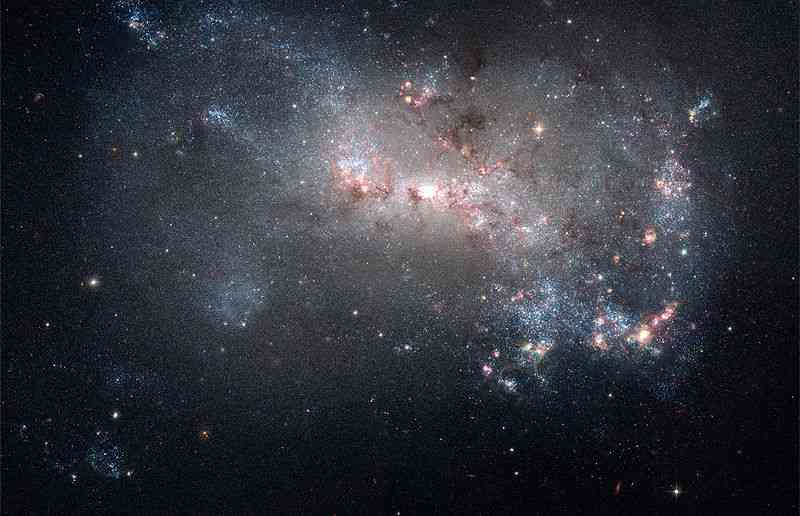
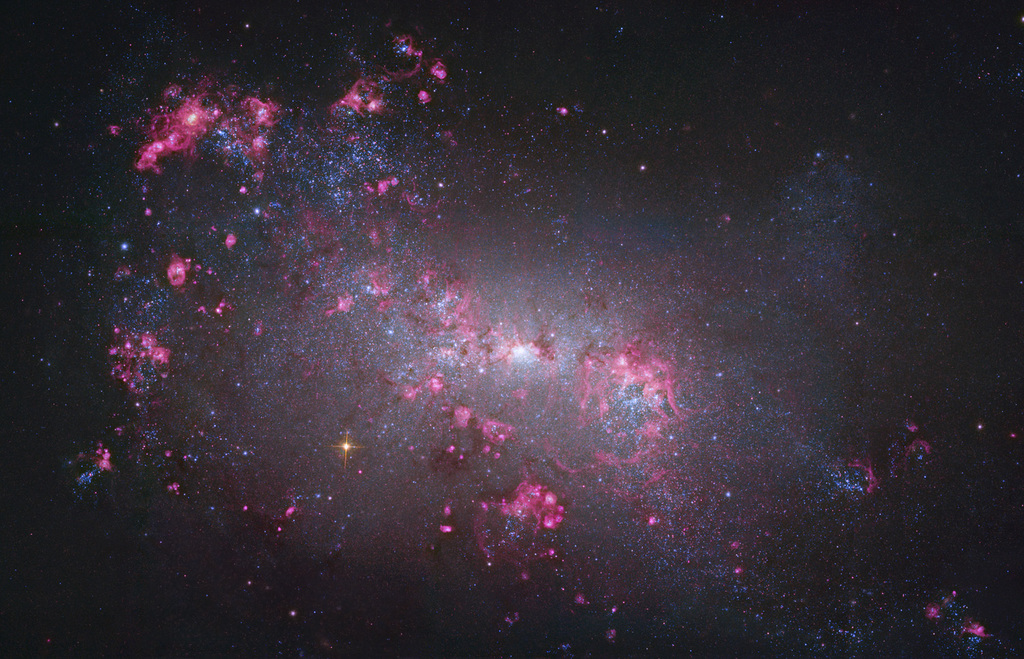
- The misfits that don’t match one of the other categories
- Often times harbor very active star forming regions
- Sometimes the result of galaxy collisions
Hubble Fork
Accuracy
- One of the simplest extensions of this to multinomial data is to use accuracy
- Accuracy is a probability that, for a random observation, the predicted class is correct \[ \text{Accuracy } = \frac{\text{Diagonal counts}}{\text{Total observations}} \]
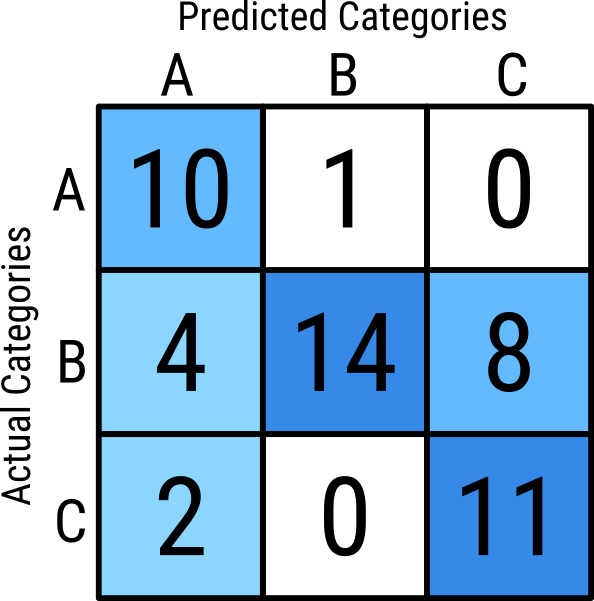
\[\begin{aligned} \text{Accuracy } &= \frac{10 + 14 + 11}{11 + 26 + 13} \\ &= \frac{35}{50} \\ &= 0.7 \end{aligned} \]