---
title: "Hubble's Fork"
author: Jed Rembold
date: March 13, 2025
slideNumber: true
theme: tokyo-night-light
highlightjs-theme: tokyo-night-light
width: 1920
height: 1080
transition: slide
---
## Announcements
- HW4 is out! You can already do the first two problems!
- HW3 Debrief form is still available until midnight tonight!
- HW4 Check-in will be available _this weekend_. Check in with your partners!
## Recap
- Determining the shape of an object while inside it is a non-trivial task
- Distance measurements are vital to piece together the shape of the Milky Way
- Parallax measurements cover a _very tiny_ portion of the Milky Way, and thus other methods are necessary
- Main sequence fitting
- Cepheid variables have their brightness fluctuate in a way that is related to their luminosity
## Discussing Today
- Basic galaxy formation
- Other examples of galaxies
- Common galaxy classifications
- Evaluating classification models
# How to Build a Galaxy
## Heavy Metal
- Stars in the MW halo are old!
- A smaller fraction of heavy elements than the Sun
- Largely low-mass, red stars
- Stars in the disk are relatively young
- A greater or equal fraction of heavy elements to the Sun
- Lots of high and low mass stars, both blue and red
- Stars in the halo must have formed **early** in the Milky Way's history
- When fewer heavy elements existed
- There is little to no ISM (gas) still in the halo to form stars from
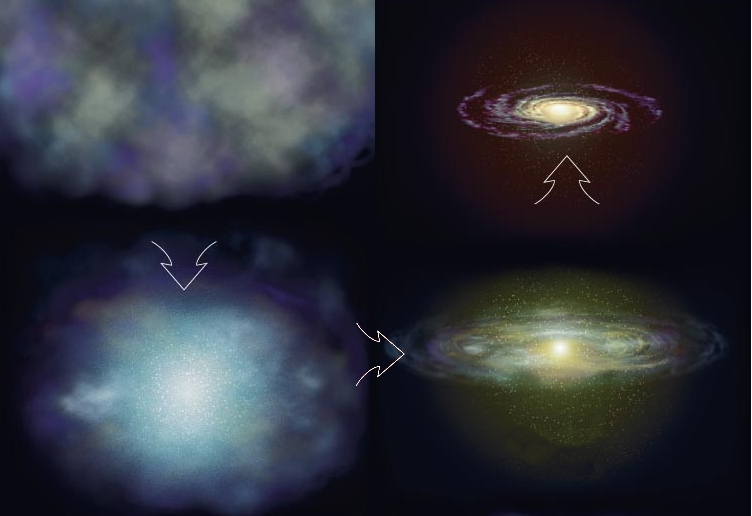
## Galaxy Formation
::::::cols
::::col
- Any theory of galactic formation needs to predict these differences between halo and disk stars
- Current theory is that of a giant _protogalactic cloud_ that collapses under gravity
- Halo stars form as it collapses
- Then get left behind as angular momentum flattens the collapsing cloud
::::
::::col
{width=100%}
::::
::::::
## Problems with Protogalactic Clouds
- Stars and star clusters would be forming the entire way throughout the cloud's collapse
- So halo stars far from the center would be older (on average) than halo stars nearer the center
- Would imply that far away halo stars should have less heavy elements
- But in truth, **all** halo stars have about the same elemental composition
- May suggest a collision between multiple protogalactic clouds?
## Galaxy Collisions
::::::cols
::::col
- Galaxies tend to cluster in groups, so collisions are a very real possibility
- Evidence that the Milky Way has already consumed two galaxies in the past
- The MW will collide with the Andromeda galaxy in about 5 billion years
::::
::::col
::::
::::::
# Nearby Galaxies
## {data-background-image='../images/ch16_deepsky.jpg'}
## Our neighbors: The Magellanic Clouds
::::::cols
::::col
{width=100%}
::::
::::col
- Large and Small (about 160,000 and 200,000 lyrs away)
- Irregular dwarf galaxies, though they do have some spiral structure
- Both orbit the Milky Way (or do they?!)
- Only visible in the Southern hemisphere
::::
::::::
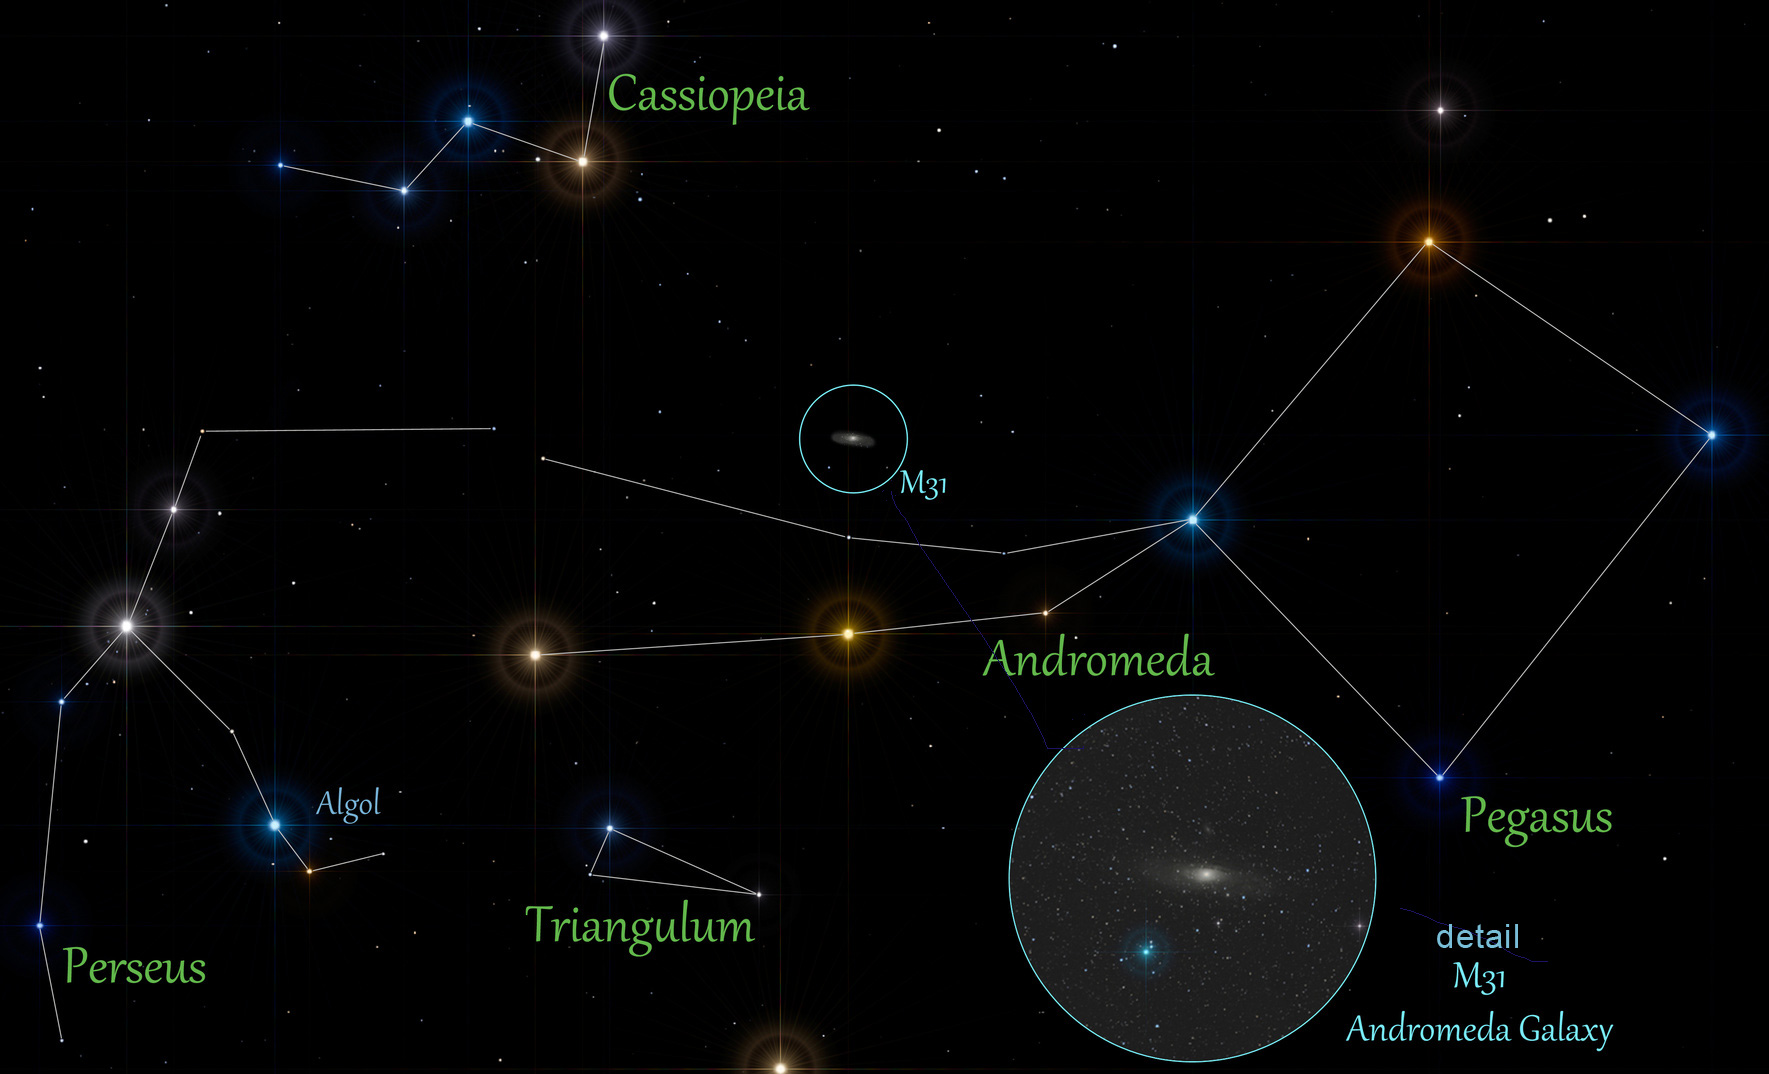
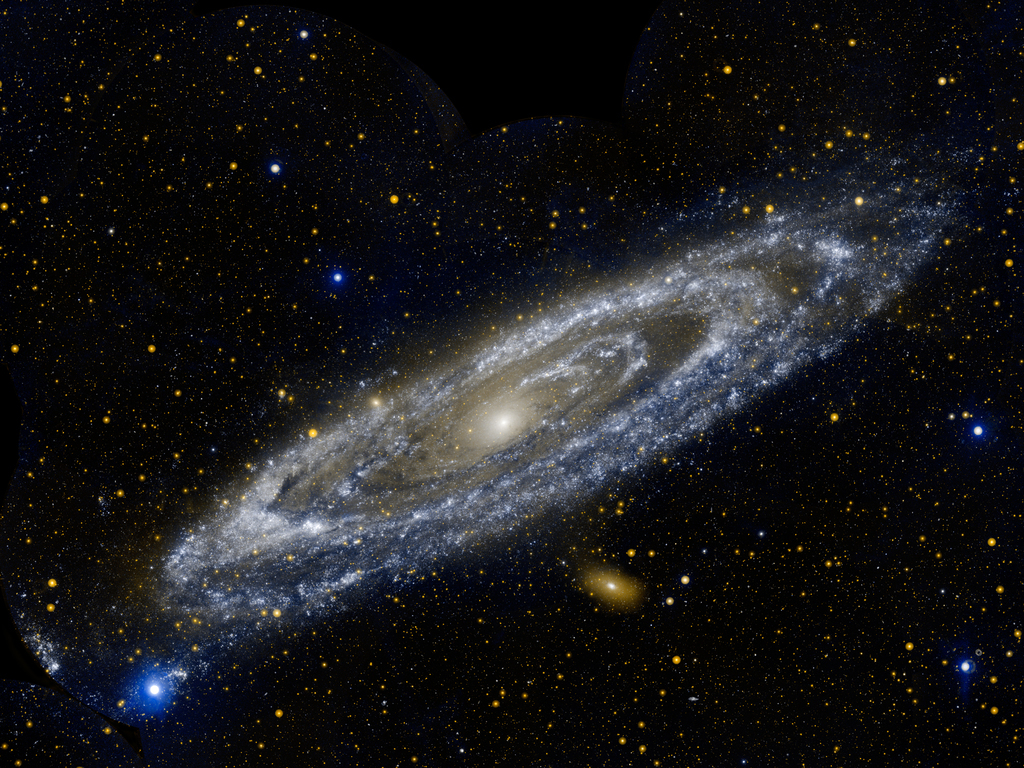
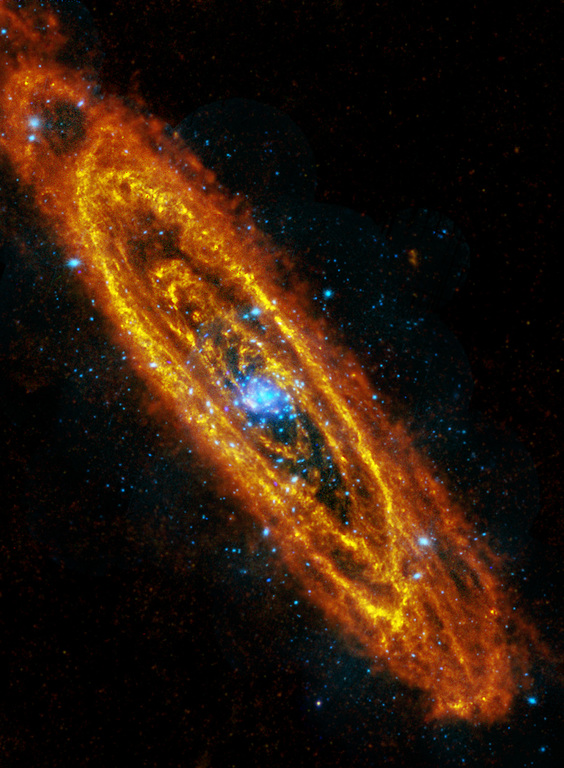
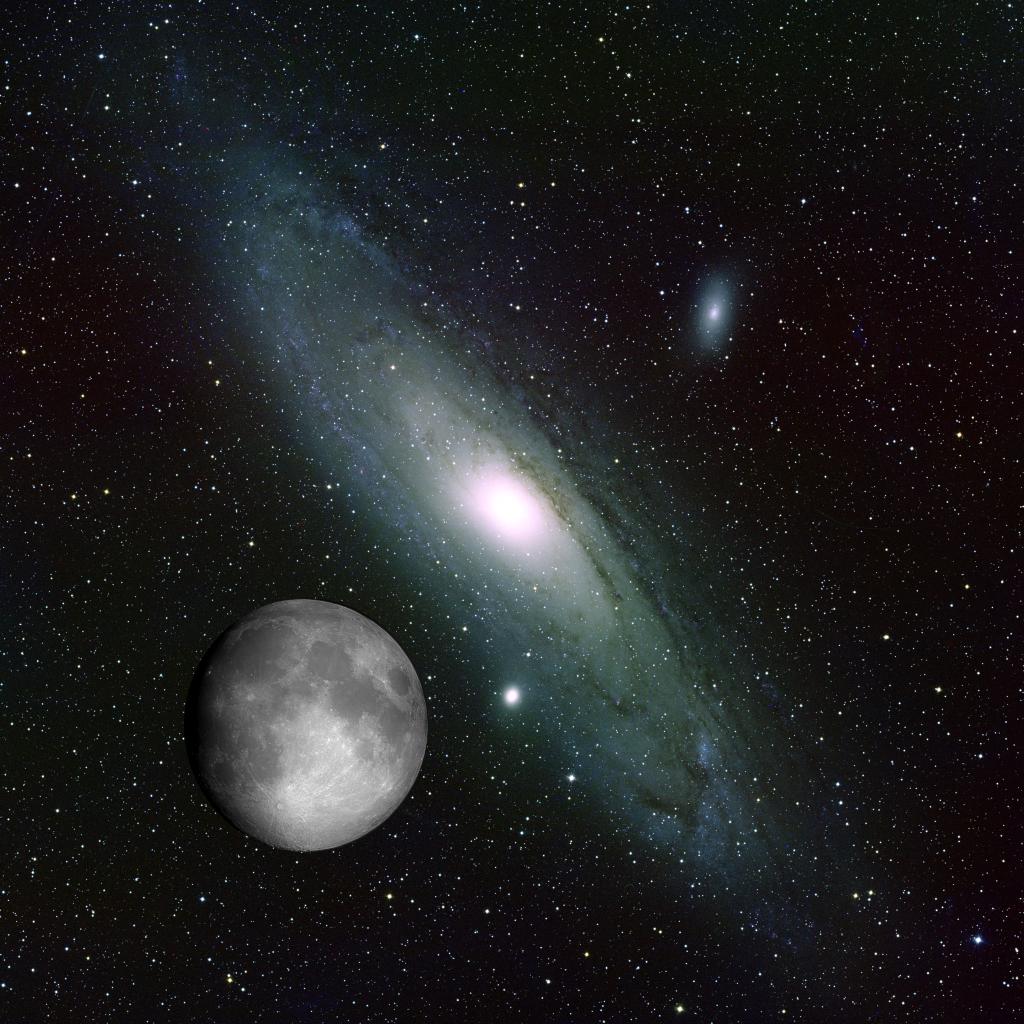
## Our neighbors: Andromeda Galaxy
{width=70%}
## Our neighbors: Andromeda Galaxy
{width=60%}
## Our neighbors: Andromeda Galaxy
::::::cols
::::col
{width=65%}
::::
::::col
{width=90%}
::::
::::::
# Types of Galaxies
## Galactic Flavors
::::::{.cols style='align-items: flex-start'}
::::col
- Looking beyond our neighbors, all galaxies tend to come in one of three main types:
Spiral
Elliptical
Irregular
::::
::::col
::::
::::::
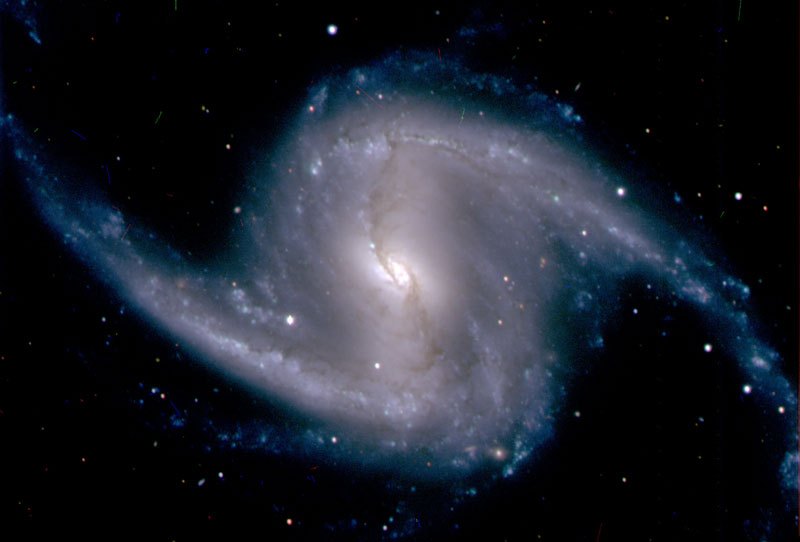
## Spiral Galaxies
::::::{.cols style='align-items: flex-start'}
::::col
- Many of the same characteristics of the Milky Way
- Spiral disk, bulge, halo, etc.
- Can come in normal or "barred" varieties
- Spiral arms can be wrapped to varying degrees
::::
::::col
:::rstack
{width=100% .fragment .current-visible .only-fragment}
{width=100% .fragment .current-visible .only-fragment}
{width=100% .fragment .current-visible .only-fragment}
:::
::::
::::::
## Spiral Arms
::::::cols
::::col

::::
::::col
- Blue regions indicate star forming regions
- Galaxy rotates at same speed, so inner regions have shorter periods
- If arms moved with the stars, they would get all wound up!
- Spiral density waves:
- Pinches everything together in that region
- Doesn't effect normal stars much
- Help molecular clouds collapse to start star formation
::::
::::::
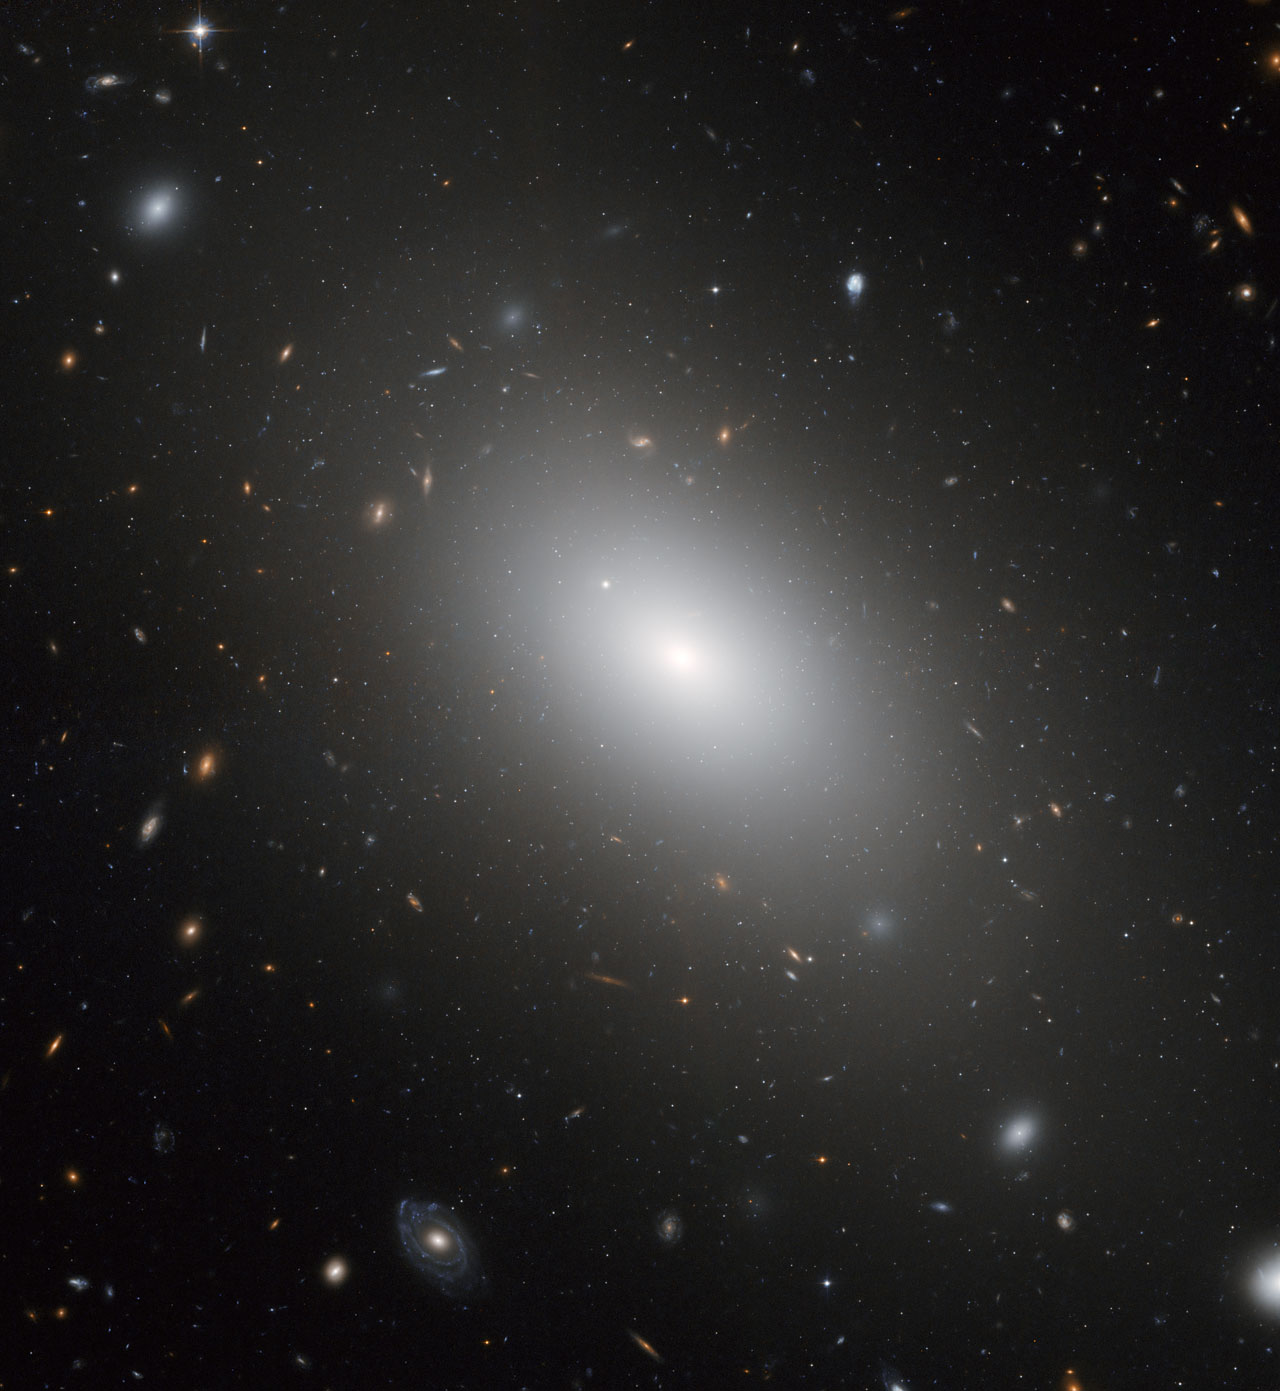
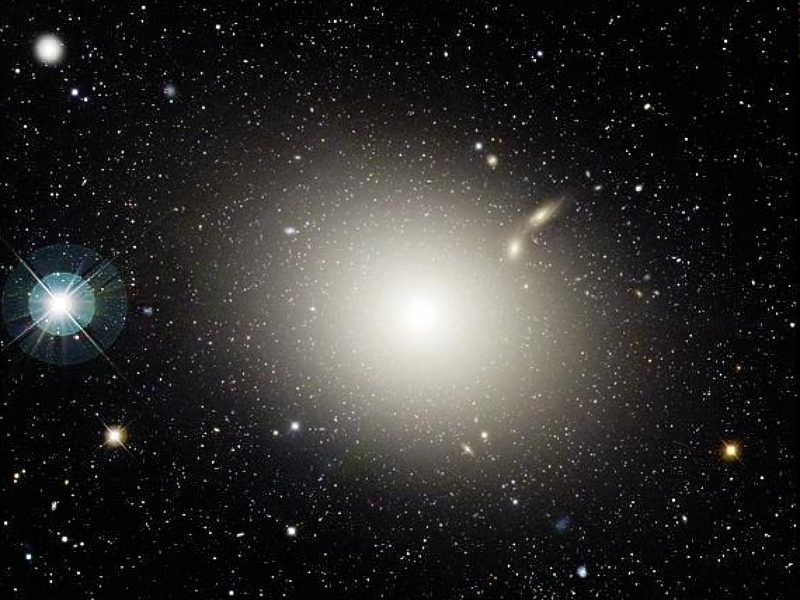
## Elliptical Galaxies
::::::{.cols style='align-items: flex-start'}
::::col
- Differ from spirals in important ways:
- Have no disk
- Rotate more slowly
- Contain very little gas or dust
- Contain mainly old stars
- Huge range of sizes:
- 0.0001-100 times the MW size
::::
::::col
:::rstack
{width=70% .fragment .current-visible .only-fragment}
{width=100% .fragment .current-visible .only-fragment}
:::
::::
::::::
## Irregular Galaxies
::::::{.cols style='align-items: flex-start'}
::::col
:::rstack
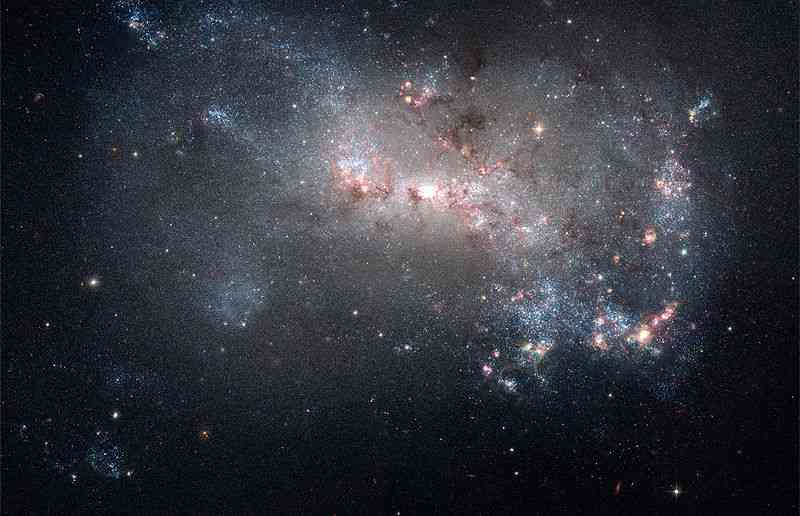{width=100% .fragment .current-visible .only-fragment}
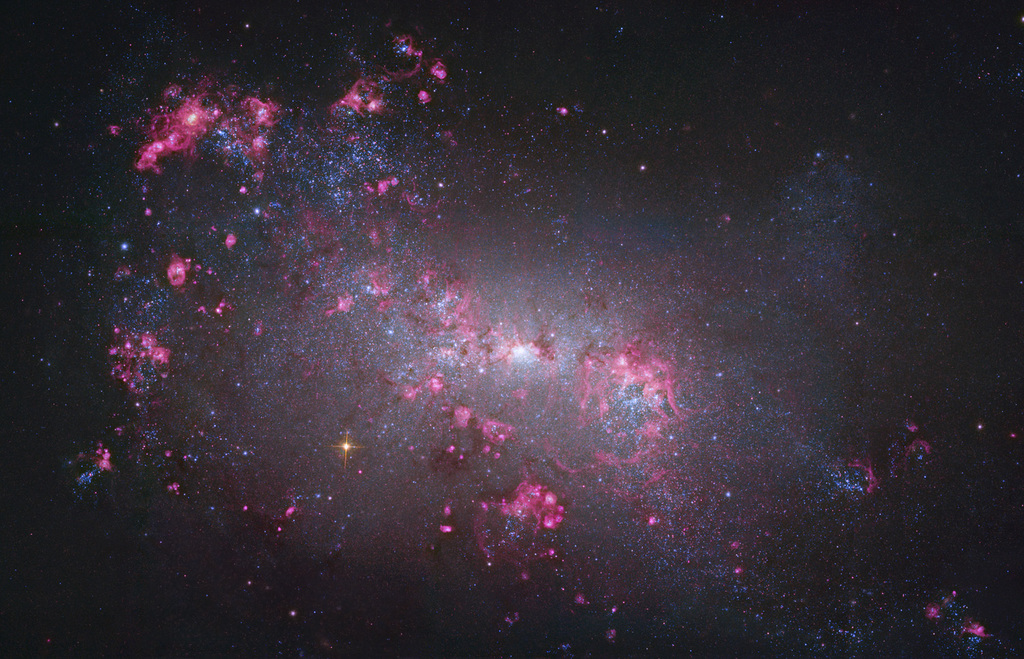{width=100% .fragment .current-visible .only-fragment}
:::
::::
::::col
- The misfits that don't match one of the other categories
- Often times harbor very active star forming regions
- Sometimes the result of galaxy collisions
::::
::::::
## Hubble Fork
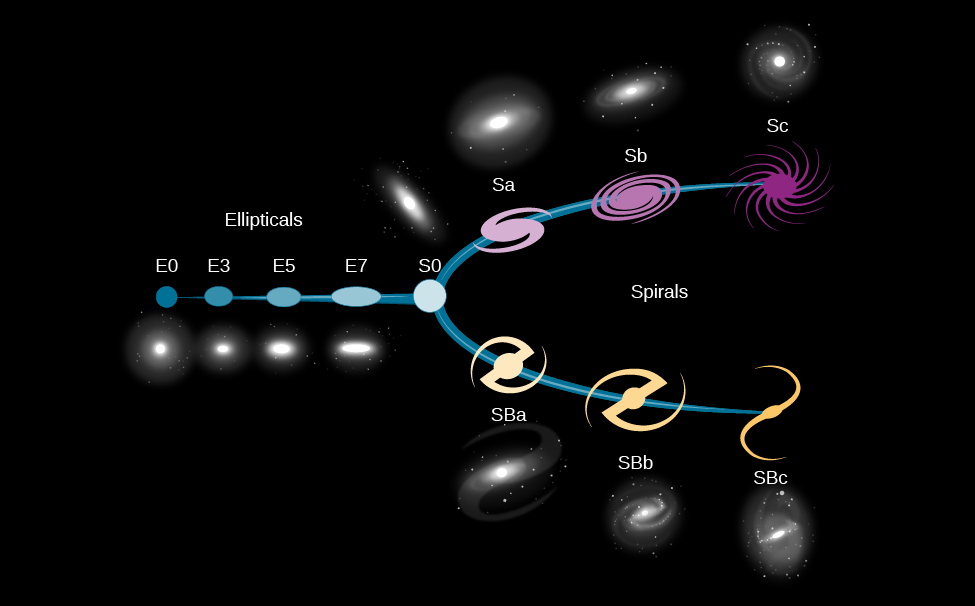{width=70%}
# Judging Classifications
## Fitting vs Classification
::::::cols
::::col
- We've seen several ways to fit models to data already
- Basic linear fitting
- Non-linear model fitting
- Both give a prediction of a continuous variable given some inputs
- Classification is about predicting a discrete variable (or factor)
::::
::::col
:::::r-stack
:::{.fragment .fragment-only}
{.fragment .fragment-only .current-only}
:::
:::{.fragment .fragment-only}
{.fragment .fragment-only .current-only}
:::
:::::
::::
::::::
## Techniques over Theory
- In this class, I'm going to focus on techniques over the underlying mathematical theory
- Problem-solving is often a game of abstraction, and using techniques as tools can help with that
- You don't need to know the details of how a least-squares fit is done to make use of it
- For rigorous work, you _should_ be aware of at least the basic theory underlying a technique, at least well enough to know if you are misusing it
- I am going to present the machine learning techniques in this unit in a similar, technique over theory fashion
- We have other classes if you want a deep dive into this sort of content!
## Be Positive!
::: {style='font-size:.9em'}
- With regression fitting, we commonly have an idea of a _residual_, which measures how far from an actual value our prediction came
- A similar idea won't hold for classification, because we either correctly classified the point, or we didn't
- Instead, for a binary classification (A or B), predictions would fall into 1 of 4 different bins:
- True positive: An observation that should have been in category A, which our model predicted was in category A
- False positive: An observation that should have been in category B, but which our model predicted would be in category A
- True negative: An observation that should have been in category B, which our model predicted was in category B
- False negative: An observation that should have been in category A, but which our model predicted would be in category B
:::
## Confusion Matrix
::::::cols
::::col
- For either binary classification or multinomial classification, a _confusion matrix_ is often the best method to summarize model prediction results visually
- Compares **actual** categories across one axis to **predicted** categories across the other
- Each bin contains a count of how many observations with that actual value were predicted
::::
::::col

::::
::::::
## Making Comparisons
- Comparing just confusion matrices can be ambiguous
- Which model best classified the data of the below options?
::::cols
:::col

:::
:::col

:::
:::col

:::
::::
## Precision and Recall
::::::cols
::::col

::::
::::{.col style='flex-grow: 2'}
- For a binary classification, there are clear methods of evaluating a model
- _Precision_ is a measure of how much you can trust the model if it claims a positive
$$ \text{Precision } = \frac{TP}{TP + FP} $$
- _Recall_ is a measure of how reliably the model finds all the positive observations
$$ \text{Recall } = \frac{TP}{TP + FN} $$
::::
::::::
## Accuracy
- One of the simplest extensions of this to multinomial data is to use _accuracy_
- Accuracy is a probability that, for a random observation, the predicted class is correct
$$ \text{Accuracy } = \frac{\text{Diagonal counts}}{\text{Total observations}} $$
:::::cols
::::col
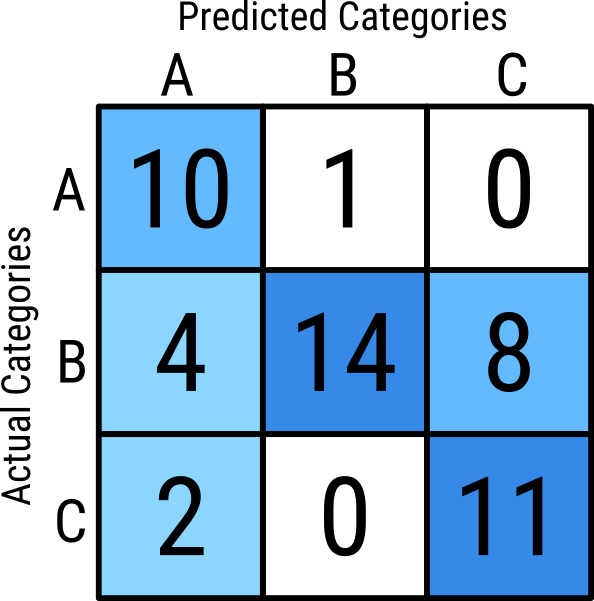{width=50%}
::::
::::col
$$\begin{aligned}
\text{Accuracy } &= \frac{10 + 14 + 11}{11 + 26 + 13} \\
&= \frac{35}{50} \\
&= 0.7
\end{aligned}
$$
::::
:::::
## Accuracy Issues
- If your data has far more of one category than others, accuracy might hide issues
- Suppose your model predicts the dominant category really well, but other categories terribly
- The odds of selecting an observation from the dominant category are high, and thus the accuracy will also look high
- But you may be doing a **terrible** job of classifying the minority classes!
- We'll introduce some alternatives going forward, but let's work with accuracy for the time being, despite its flaws.
## Supervised Machine Learning
- There are a host of ways classification problems can be solved, but many modern approaches fall under the umbrella of _supervised machine learning_
- The idea is to use different iterative approachs and **labeled** data to incrementally improve the model until a certain threshold is reached
- The exact model structure can still vary!
- The "Supervised" part of the name implies that the data must be labeled. That is, the model is trained on data with **known categories**
- Sometimes, this is easy and readily available. Othertimes, it can be an issue.
## Training vs Testing
- Because of the iterative approach, many models will, if given enough time, _perfectly_ model the data
- **THIS IS A BAD THING!**
- If a model too perfectly matches a given set of data, the chances of it being able to accurate predict other data have greatly diminished
- Generally called _overfitting_
- The potential for this generally increases with model complexity
- It is common then to set aside a portion of data that the model is **not** trained on to serve as a test to compare the model against
- These are generally denoted as the "training" and "testing" data sets
- A common split is to put about 80% of the observations into the training set, and reserve the remaining 20% for the testing

 ::::
::::::
## Spiral Galaxies
::::::{.cols style='align-items: flex-start'}
::::col
- Many of the same characteristics of the Milky Way
- Spiral disk, bulge, halo, etc.
- Can come in normal or "barred" varieties
- Spiral arms can be wrapped to varying degrees
::::
::::col
:::rstack
{width=100% .fragment .current-visible .only-fragment}
{width=100% .fragment .current-visible .only-fragment}
{width=100% .fragment .current-visible .only-fragment}
:::
::::
::::::
## Spiral Arms
::::::cols
::::col

::::
::::col
- Blue regions indicate star forming regions
- Galaxy rotates at same speed, so inner regions have shorter periods
- If arms moved with the stars, they would get all wound up!
- Spiral density waves:
- Pinches everything together in that region
- Doesn't effect normal stars much
- Help molecular clouds collapse to start star formation
::::
::::::
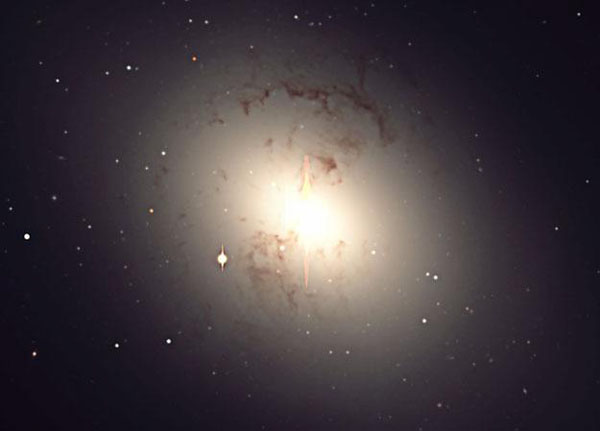
## Elliptical Galaxies
::::::{.cols style='align-items: flex-start'}
::::col
- Differ from spirals in important ways:
- Have no disk
- Rotate more slowly
- Contain very little gas or dust
- Contain mainly old stars
- Huge range of sizes:
- 0.0001-100 times the MW size
::::
::::col
:::rstack
{width=70% .fragment .current-visible .only-fragment}
{width=100% .fragment .current-visible .only-fragment}
:::
::::
::::::
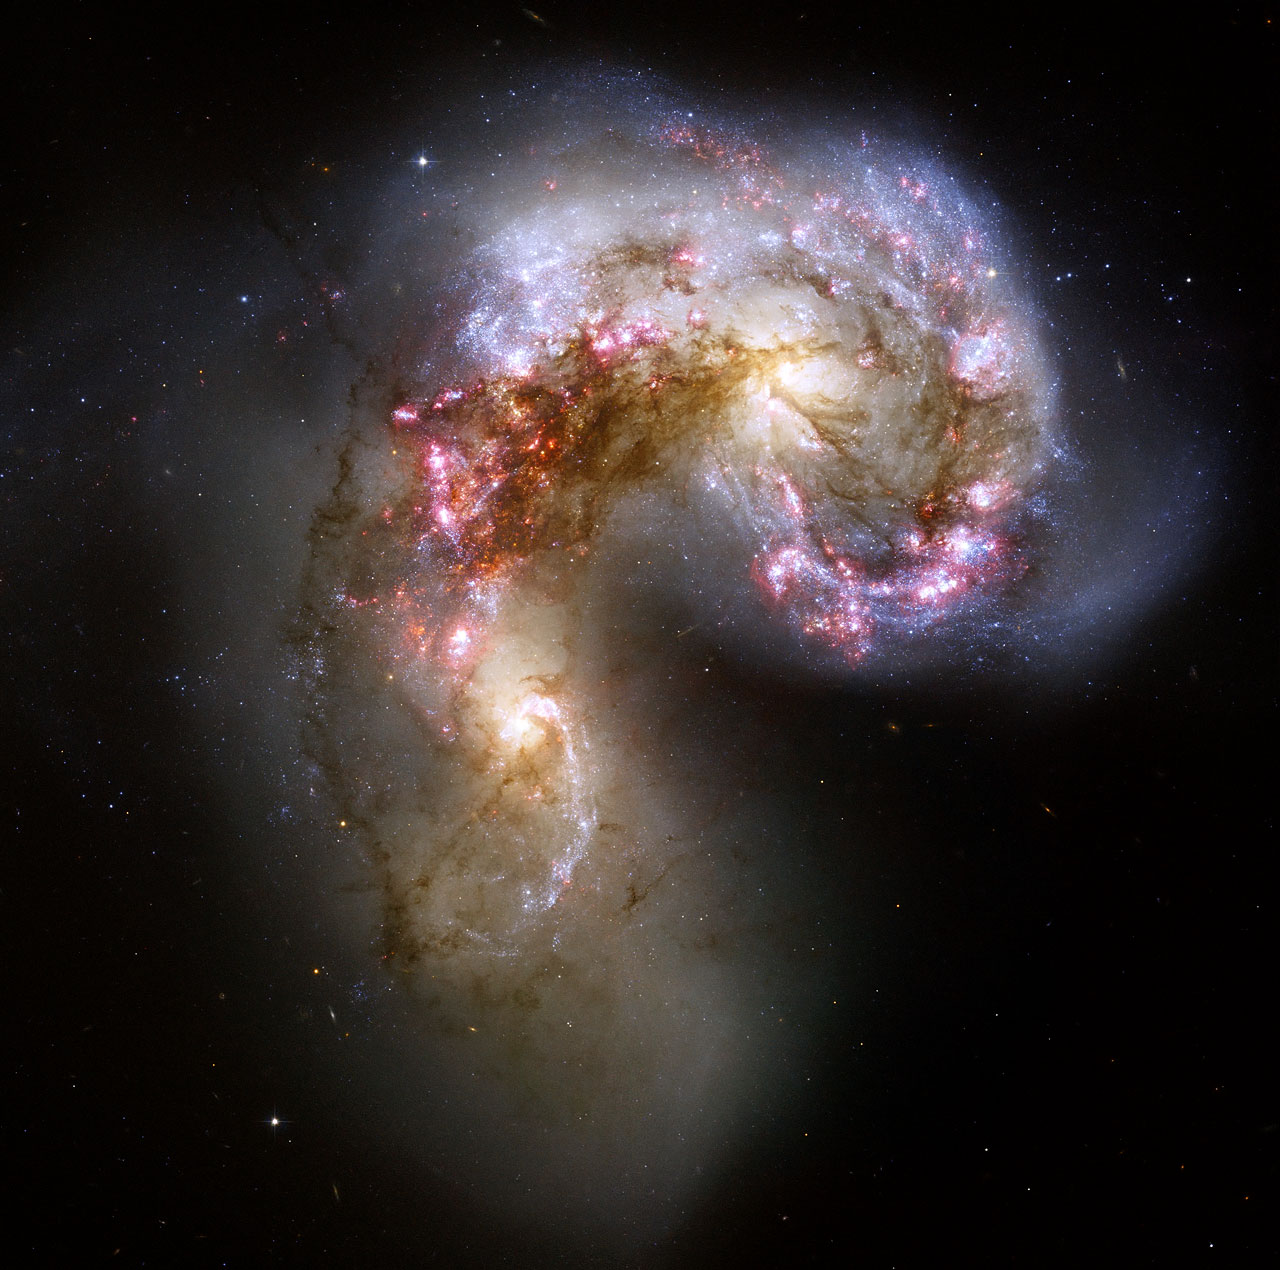
## Irregular Galaxies
::::::{.cols style='align-items: flex-start'}
::::col
:::rstack
{width=100% .fragment .current-visible .only-fragment}
{width=100% .fragment .current-visible .only-fragment}
:::
::::
::::col
- The misfits that don't match one of the other categories
- Often times harbor very active star forming regions
- Sometimes the result of galaxy collisions
::::
::::::
## Hubble Fork
{width=70%}
# Judging Classifications
## Fitting vs Classification
::::::cols
::::col
- We've seen several ways to fit models to data already
- Basic linear fitting
- Non-linear model fitting
- Both give a prediction of a continuous variable given some inputs
- Classification is about predicting a discrete variable (or factor)
::::
::::col
:::::r-stack
:::{.fragment .fragment-only}
{.fragment .fragment-only .current-only}
:::
:::{.fragment .fragment-only}
{.fragment .fragment-only .current-only}
:::
:::::
::::
::::::
## Techniques over Theory
- In this class, I'm going to focus on techniques over the underlying mathematical theory
- Problem-solving is often a game of abstraction, and using techniques as tools can help with that
- You don't need to know the details of how a least-squares fit is done to make use of it
- For rigorous work, you _should_ be aware of at least the basic theory underlying a technique, at least well enough to know if you are misusing it
- I am going to present the machine learning techniques in this unit in a similar, technique over theory fashion
- We have other classes if you want a deep dive into this sort of content!
## Be Positive!
::: {style='font-size:.9em'}
- With regression fitting, we commonly have an idea of a _residual_, which measures how far from an actual value our prediction came
- A similar idea won't hold for classification, because we either correctly classified the point, or we didn't
- Instead, for a binary classification (A or B), predictions would fall into 1 of 4 different bins:
- True positive: An observation that should have been in category A, which our model predicted was in category A
- False positive: An observation that should have been in category B, but which our model predicted would be in category A
- True negative: An observation that should have been in category B, which our model predicted was in category B
- False negative: An observation that should have been in category A, but which our model predicted would be in category B
:::
## Confusion Matrix
::::::cols
::::col
- For either binary classification or multinomial classification, a _confusion matrix_ is often the best method to summarize model prediction results visually
- Compares **actual** categories across one axis to **predicted** categories across the other
- Each bin contains a count of how many observations with that actual value were predicted
::::
::::col

::::
::::::
## Making Comparisons
- Comparing just confusion matrices can be ambiguous
- Which model best classified the data of the below options?
::::cols
:::col

:::
:::col

:::
:::col

:::
::::
## Precision and Recall
::::::cols
::::col

::::
::::{.col style='flex-grow: 2'}
- For a binary classification, there are clear methods of evaluating a model
- _Precision_ is a measure of how much you can trust the model if it claims a positive
$$ \text{Precision } = \frac{TP}{TP + FP} $$
- _Recall_ is a measure of how reliably the model finds all the positive observations
$$ \text{Recall } = \frac{TP}{TP + FN} $$
::::
::::::
## Accuracy
- One of the simplest extensions of this to multinomial data is to use _accuracy_
- Accuracy is a probability that, for a random observation, the predicted class is correct
$$ \text{Accuracy } = \frac{\text{Diagonal counts}}{\text{Total observations}} $$
:::::cols
::::col
{width=50%}
::::
::::col
$$\begin{aligned}
\text{Accuracy } &= \frac{10 + 14 + 11}{11 + 26 + 13} \\
&= \frac{35}{50} \\
&= 0.7
\end{aligned}
$$
::::
:::::
## Accuracy Issues
- If your data has far more of one category than others, accuracy might hide issues
- Suppose your model predicts the dominant category really well, but other categories terribly
- The odds of selecting an observation from the dominant category are high, and thus the accuracy will also look high
- But you may be doing a **terrible** job of classifying the minority classes!
- We'll introduce some alternatives going forward, but let's work with accuracy for the time being, despite its flaws.
## Supervised Machine Learning
- There are a host of ways classification problems can be solved, but many modern approaches fall under the umbrella of _supervised machine learning_
- The idea is to use different iterative approachs and **labeled** data to incrementally improve the model until a certain threshold is reached
- The exact model structure can still vary!
- The "Supervised" part of the name implies that the data must be labeled. That is, the model is trained on data with **known categories**
- Sometimes, this is easy and readily available. Othertimes, it can be an issue.
## Training vs Testing
- Because of the iterative approach, many models will, if given enough time, _perfectly_ model the data
- **THIS IS A BAD THING!**
- If a model too perfectly matches a given set of data, the chances of it being able to accurate predict other data have greatly diminished
- Generally called _overfitting_
- The potential for this generally increases with model complexity
- It is common then to set aside a portion of data that the model is **not** trained on to serve as a test to compare the model against
- These are generally denoted as the "training" and "testing" data sets
- A common split is to put about 80% of the observations into the training set, and reserve the remaining 20% for the testing
::::
::::::
## Spiral Galaxies
::::::{.cols style='align-items: flex-start'}
::::col
- Many of the same characteristics of the Milky Way
- Spiral disk, bulge, halo, etc.
- Can come in normal or "barred" varieties
- Spiral arms can be wrapped to varying degrees
::::
::::col
:::rstack
{width=100% .fragment .current-visible .only-fragment}
{width=100% .fragment .current-visible .only-fragment}
{width=100% .fragment .current-visible .only-fragment}
:::
::::
::::::
## Spiral Arms
::::::cols
::::col

::::
::::col
- Blue regions indicate star forming regions
- Galaxy rotates at same speed, so inner regions have shorter periods
- If arms moved with the stars, they would get all wound up!
- Spiral density waves:
- Pinches everything together in that region
- Doesn't effect normal stars much
- Help molecular clouds collapse to start star formation
::::
::::::
## Elliptical Galaxies
::::::{.cols style='align-items: flex-start'}
::::col
- Differ from spirals in important ways:
- Have no disk
- Rotate more slowly
- Contain very little gas or dust
- Contain mainly old stars
- Huge range of sizes:
- 0.0001-100 times the MW size
::::
::::col
:::rstack
{width=70% .fragment .current-visible .only-fragment}
{width=100% .fragment .current-visible .only-fragment}
:::
::::
::::::
## Irregular Galaxies
::::::{.cols style='align-items: flex-start'}
::::col
:::rstack
{width=100% .fragment .current-visible .only-fragment}
{width=100% .fragment .current-visible .only-fragment}
:::
::::
::::col
- The misfits that don't match one of the other categories
- Often times harbor very active star forming regions
- Sometimes the result of galaxy collisions
::::
::::::
## Hubble Fork
{width=70%}
# Judging Classifications
## Fitting vs Classification
::::::cols
::::col
- We've seen several ways to fit models to data already
- Basic linear fitting
- Non-linear model fitting
- Both give a prediction of a continuous variable given some inputs
- Classification is about predicting a discrete variable (or factor)
::::
::::col
:::::r-stack
:::{.fragment .fragment-only}
{.fragment .fragment-only .current-only}
:::
:::{.fragment .fragment-only}
{.fragment .fragment-only .current-only}
:::
:::::
::::
::::::
## Techniques over Theory
- In this class, I'm going to focus on techniques over the underlying mathematical theory
- Problem-solving is often a game of abstraction, and using techniques as tools can help with that
- You don't need to know the details of how a least-squares fit is done to make use of it
- For rigorous work, you _should_ be aware of at least the basic theory underlying a technique, at least well enough to know if you are misusing it
- I am going to present the machine learning techniques in this unit in a similar, technique over theory fashion
- We have other classes if you want a deep dive into this sort of content!
## Be Positive!
::: {style='font-size:.9em'}
- With regression fitting, we commonly have an idea of a _residual_, which measures how far from an actual value our prediction came
- A similar idea won't hold for classification, because we either correctly classified the point, or we didn't
- Instead, for a binary classification (A or B), predictions would fall into 1 of 4 different bins:
- True positive: An observation that should have been in category A, which our model predicted was in category A
- False positive: An observation that should have been in category B, but which our model predicted would be in category A
- True negative: An observation that should have been in category B, which our model predicted was in category B
- False negative: An observation that should have been in category A, but which our model predicted would be in category B
:::
## Confusion Matrix
::::::cols
::::col
- For either binary classification or multinomial classification, a _confusion matrix_ is often the best method to summarize model prediction results visually
- Compares **actual** categories across one axis to **predicted** categories across the other
- Each bin contains a count of how many observations with that actual value were predicted
::::
::::col

::::
::::::
## Making Comparisons
- Comparing just confusion matrices can be ambiguous
- Which model best classified the data of the below options?
::::cols
:::col

:::
:::col

:::
:::col

:::
::::
## Precision and Recall
::::::cols
::::col

::::
::::{.col style='flex-grow: 2'}
- For a binary classification, there are clear methods of evaluating a model
- _Precision_ is a measure of how much you can trust the model if it claims a positive
$$ \text{Precision } = \frac{TP}{TP + FP} $$
- _Recall_ is a measure of how reliably the model finds all the positive observations
$$ \text{Recall } = \frac{TP}{TP + FN} $$
::::
::::::
## Accuracy
- One of the simplest extensions of this to multinomial data is to use _accuracy_
- Accuracy is a probability that, for a random observation, the predicted class is correct
$$ \text{Accuracy } = \frac{\text{Diagonal counts}}{\text{Total observations}} $$
:::::cols
::::col
{width=50%}
::::
::::col
$$\begin{aligned}
\text{Accuracy } &= \frac{10 + 14 + 11}{11 + 26 + 13} \\
&= \frac{35}{50} \\
&= 0.7
\end{aligned}
$$
::::
:::::
## Accuracy Issues
- If your data has far more of one category than others, accuracy might hide issues
- Suppose your model predicts the dominant category really well, but other categories terribly
- The odds of selecting an observation from the dominant category are high, and thus the accuracy will also look high
- But you may be doing a **terrible** job of classifying the minority classes!
- We'll introduce some alternatives going forward, but let's work with accuracy for the time being, despite its flaws.
## Supervised Machine Learning
- There are a host of ways classification problems can be solved, but many modern approaches fall under the umbrella of _supervised machine learning_
- The idea is to use different iterative approachs and **labeled** data to incrementally improve the model until a certain threshold is reached
- The exact model structure can still vary!
- The "Supervised" part of the name implies that the data must be labeled. That is, the model is trained on data with **known categories**
- Sometimes, this is easy and readily available. Othertimes, it can be an issue.
## Training vs Testing
- Because of the iterative approach, many models will, if given enough time, _perfectly_ model the data
- **THIS IS A BAD THING!**
- If a model too perfectly matches a given set of data, the chances of it being able to accurate predict other data have greatly diminished
- Generally called _overfitting_
- The potential for this generally increases with model complexity
- It is common then to set aside a portion of data that the model is **not** trained on to serve as a test to compare the model against
- These are generally denoted as the "training" and "testing" data sets
- A common split is to put about 80% of the observations into the training set, and reserve the remaining 20% for the testing