Measuring Events
Jed Rembold
July 30, 2025
Announcements
- Milestone 5 due next Tuesday night!
- One last optional milestone after that, whose score will replace your lowest other milestone grade
- Don’t forget your weekly reflections today (if you haven’t already for this week)!
Tonight
- Some Event Backtracking
- Kafka’s Group ID is brittle for data pipelines. How can we do better?
- Metrics
- What are metrics?
- Prometheus
- Postgres Exporter
- Node Exporter
- Airflow Exporter
- Project Work
Event Backtracking
The Problem
- Last week when introducing Kafka, we discussed the importance of offsets
- Utilizing a group id and auto-commiting was put forth as a method to ensure you didn’t double count events
- This is simple, and works
- But it is fragile
- What happens if you consume events but then some downstream task fails?
- What happens if you want to backfill?
- So what other options do we have?
Manual Offsets
- To get full flexibility, we have to accept responsibility to manage the offsets ourselves
- We would thus read in events only with offsets in a particular range during a snapshot
- Options:
- Track read event offsets in a database somewhere
- Look up desired offsets from timestamps
- Given that our snapshots are usually timestamp bracketed anyway, the second option probably makes the most sense
Deactivate Autocommit
To get started, in our config we will want to deactivate
confluent_kafka’s default automatic committingThis ensures that we are purely in control of what offset(s) we begin reading events from
config = {
  'bootstrap.servers': |||your server|||,
  'group.id': |||your group|||,
  'enable.auto.commit': False
}
Partitions
- To request specific offsets, we also need to explicitly account for
the presence of partitions
- Recall that events from a particular topic might be spread across several partitions to distribute load
- To ensure we get all the events, we need to explicitly request events from each different partition
- How do we know what partitions exist?
- We can request that metadata from the consumer
con = Consumer(config)
metadata = con.list_topics(topic=|||your topic|||, timeout=10)
partitions = metadata.topics[|||your topic|||].partitions
Offset by Time
- Now, for each partition, we need to figure out which offsets we want, ideally based on a timestamp
- The Consumer class has a method exactly for this, called
.offsets_for_times- Takes as an argument a
TopicPartitionobject (or list of them)- These essentially describe a single partition of a topic (they are aptly named)
example = con.offsets_for_times( TopicPartition(|||your topic|||, |||chosen partition|||, |||kafka timestamp|||), timeout = 10) - Takes as an argument a
- It returns another TopicPartition object, but one in which the timestamps have been converted to the equivalent offset that immediately follows the given timestamp
Kafka Timestamps
Don’t forget that Kafka uses timestamps in a Unix format, but in milliseconds
If you have a pendulum
DateTimeobject then, you need to convert to a timestamp and then multiply by 1000normal_time = pendulum.now() kafta_time = int(normal_time.timestamp() * 1000)DateTimeobjects usually track to the microsecond, so you’ll have some decimals left over that you should truncate withint
Extracting Offsets
offsets_for_timesreturns to you a single (or list of)TopicPartition(s)In some cases, that is exactly what you want
In other cases, you may want to just extract the offset(s) from the
TopicPartitionDoing so is simple:
desired_offset = example.offsetYou can of course loop over a list of
TopicPartitions to extract all the offsets
Assigning Things
- Recall previously that we told the consumer to subscribe to a particular topic
- Then handling things manually, we instead assign a
particular
TopicPartitionto the consumer- This might be a single
TopicPartitionor it might be a list ofTopicPartitions
|||consumer|||.assign(|||your single or list of topic partitions|||) - This might be a single
- Past this, the
pollloop looks very similar
Overall Gameplan
- For snapshots then, you might follow the below general algorithm:
- Determine all the partitions utilized by the desired topic
- Determine the start and end times of the snapshot in a Kafka timestamp
- Use
offsets_for_timesto generateTopicPartition(s) for both the start and end times- This effectively gets you the starting offset and the ending offset for each partition during that day. These are what you want to loop over and snapshot
- Extract the ending offsets from the
TopicPartition. The starts are already good to go. - Record or save what the ending offset is for each partition
- As long as you haven’t read in all the desired offset events, keep
looping and polling the consumer
- Only “save” messages that are in the correct range of offsets
- When you reach the end of a particular partition, remove it from your list/dictionary/set of desired offset_ranges
- Union the new data with any previous snapshot (if it exists)
Tricky Edge Cases!
- Partitions within a topic are append-only and immutable, so no data would ever change, and could only be added to
- However, topics usually have retention-policies!
- What happens if you try to take a snapshot of a day when all events
have been retired due to retention?
- Your starting and ending offsets would give the same value! You should probably not loop or create a new snapshot at all in that case.
- What happens if you try to manually take a snapshot halfway through
a day?
- The starting and ending offsets would be different, so you’d try to snapshot
- But you’d have lost half your events, and overwriting your old snapshot would lose you data!
- This is why the
UNIONstep is important
Break!
Metrics
Observability
- For the remainer of the semester I want to spend some time dwelling on topics of observability
- These are topics that revolve largely around monitoring and
understanding what your pipeline is doing
- Many of these concepts can be data sources in and of themselves, though we will focus mostly on their ability to help us manage and understand our complex pipelines
- Why now?
- I think most everyone has reached a level of complexity in their projects where they could start appreciating what good observability might lend them
- It exposes you to some concepts and software that might still be a data source you’d see in the future
The Triangle of Observability
A Bit on Traces
- Of these, the one that we will spend the least time with in this class is traces
- A trace is a selective monitoring of a particular event and any cascading events that result
- Generally impossible to trace everything, and so only a representative sample of the key events are followed and recorded
- Looking at an aggregate of these though can still inform about how information is moving through a system
- Can also be useful for troubleshooting, to identify where things have gone wrong or where bottlenecks are located
Metrics
- For the rest of today, we want to focus on metrics
- A metric is a numeric count or aggregation of events that are
occurring
- E.g. Visits to a website, clicks of a button, DAG run time
- These usually have a focus on real-time feedback, so that you could quickly identify if something is wrong from various metrics
- What metrics might help you monitor your data pipelines?
The Gift of Fire
- If you have a lot of systems, collecting metrics is almost a full data-pipeline in itself, just simpler
- Generally push and pull models are available
- Easily the biggest open-source player at the moment is Prometheus
- Prometheus operates on a pull model, where it periodically polls connected clients to access their latest metrics
- Stores everything in a time-series database, which it then makes available for downstream users (hello Grafana)
Prometheus Visualized
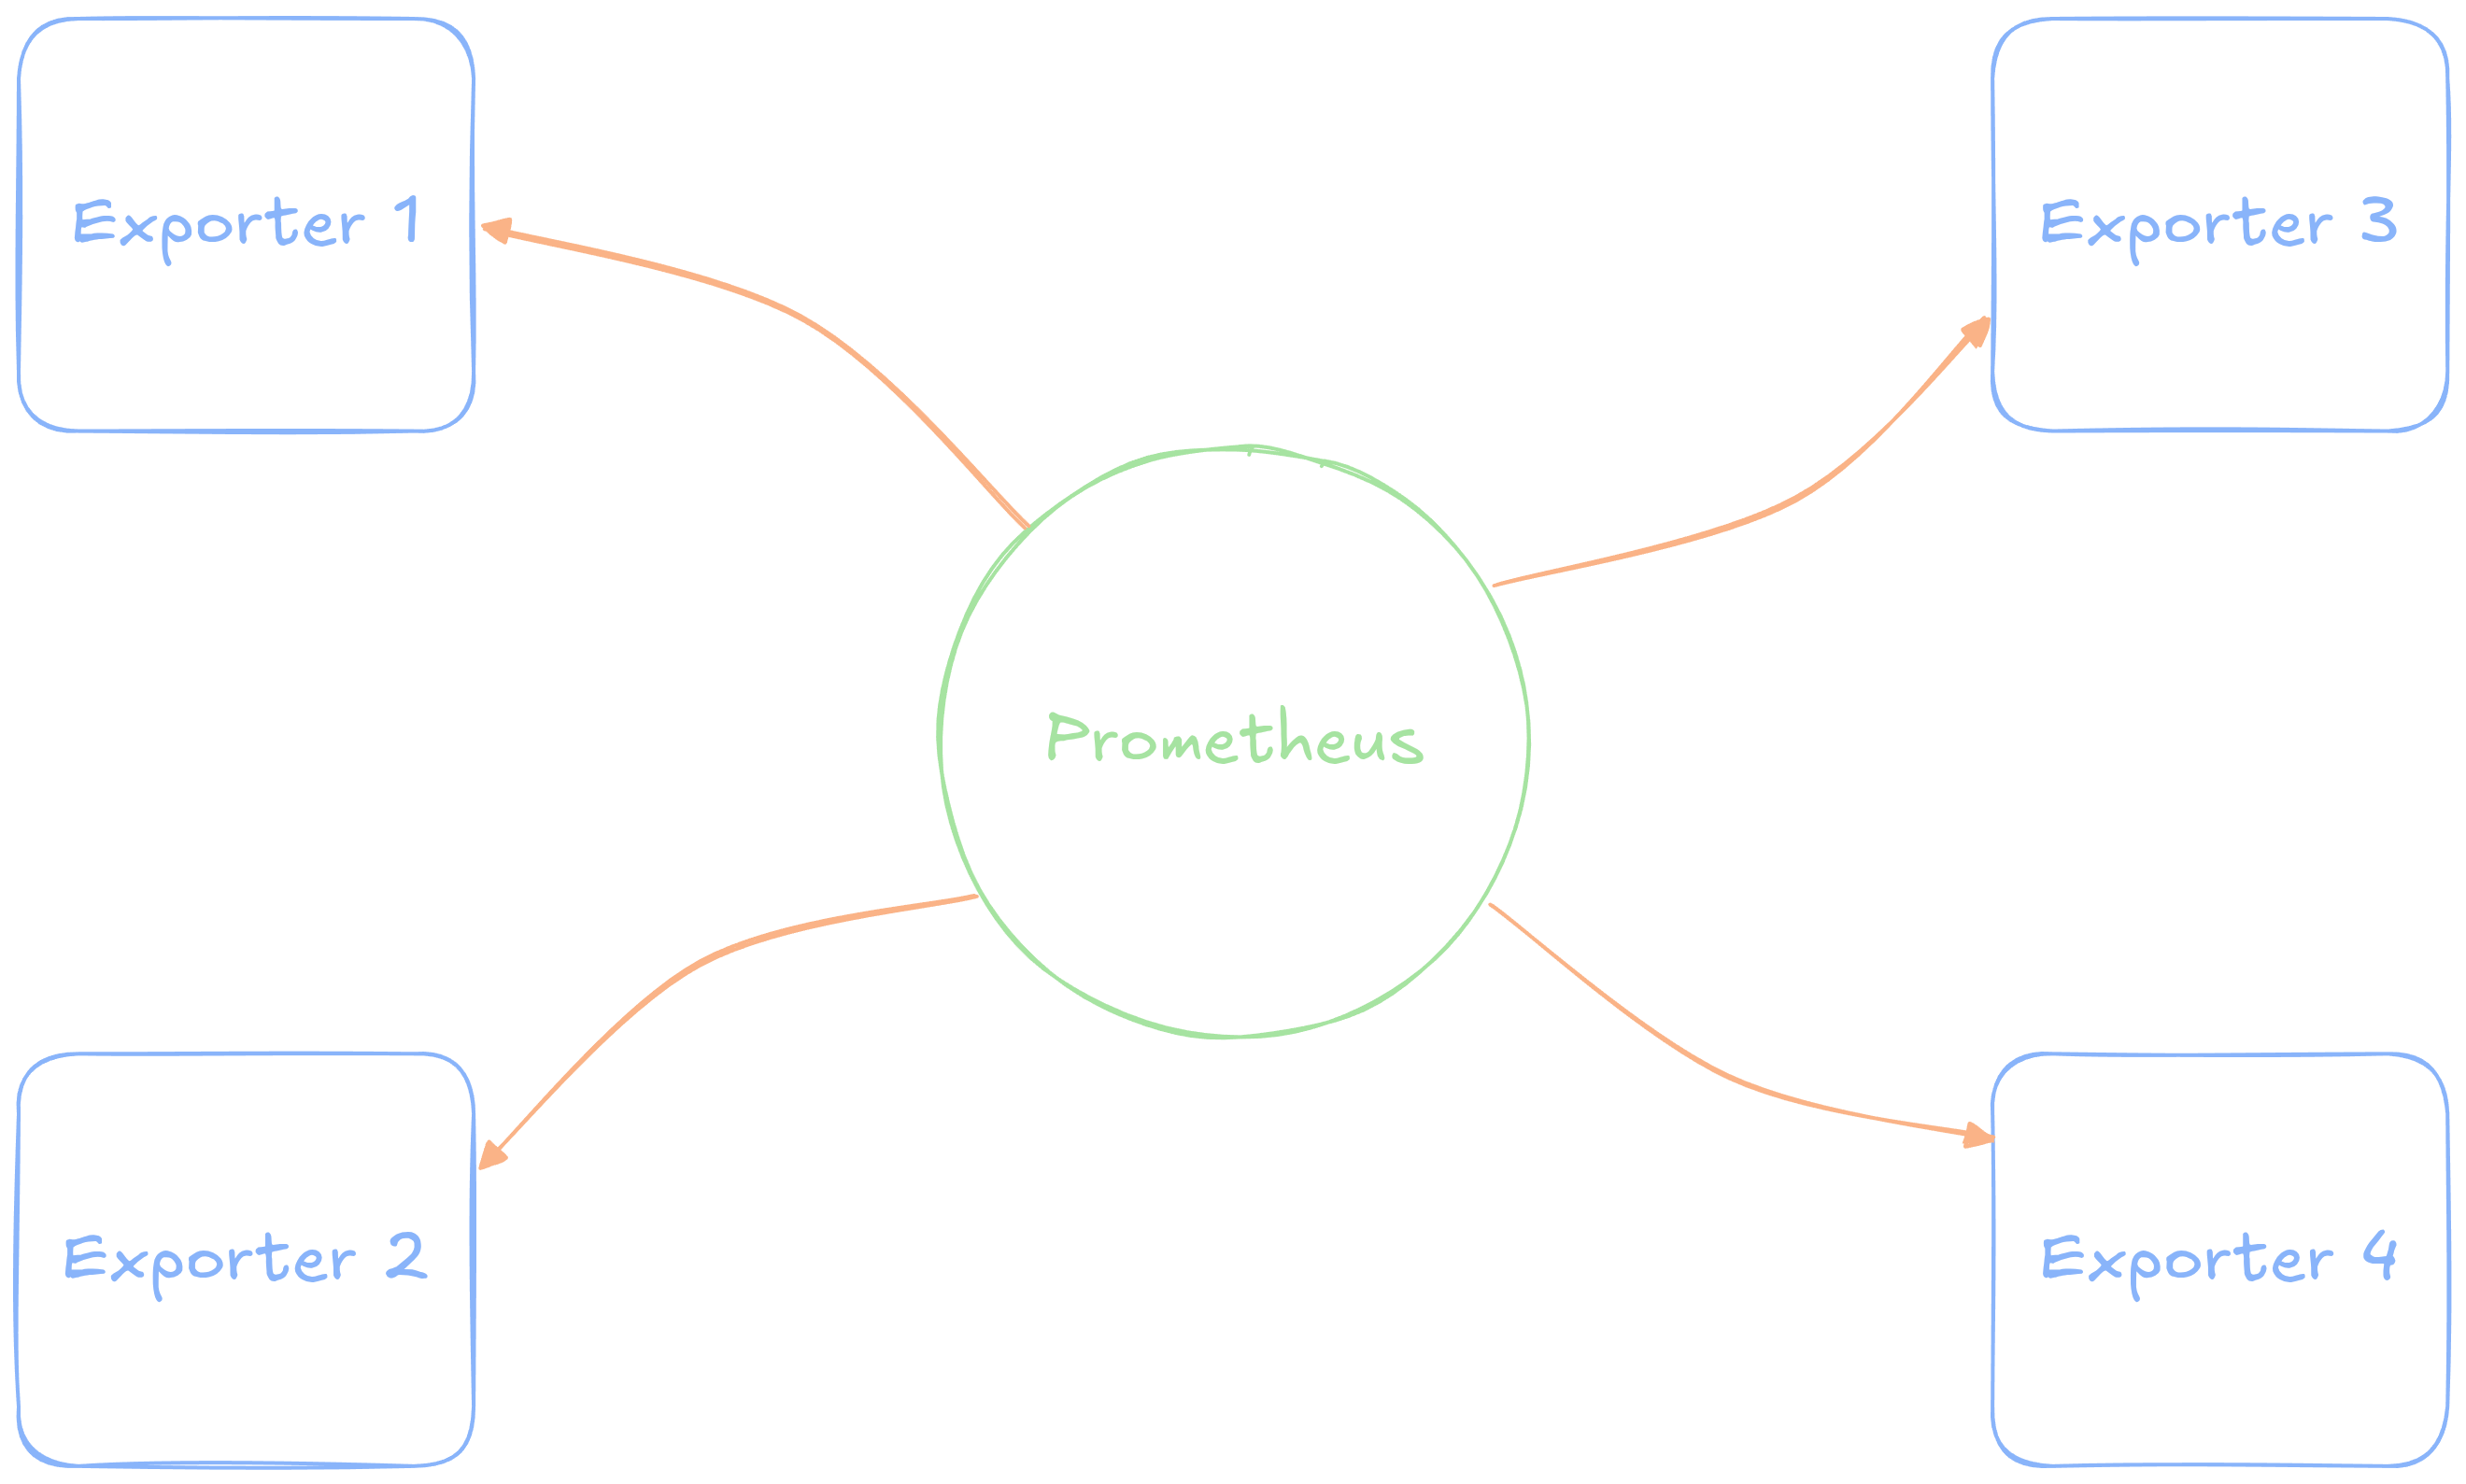
Exporters
- Once Prometheus itself is setup, most of the effort comes from the exporters
- These make various metrics available to Prometheus, usually through an API endpoint
- These could be handwritten, for bespoke software
- But for existing software, tons of exporters
already exist!
- Node exporter for metrics about the computer or VM
- Postgres exporter for metrics about a Postgres database
- Statsd exporter for Airflow metrics
- And many more!
- Many bits of software also offer native Prometheus metrics
- MiniIO, for instance, has a metrics endpoint that Prometheus can read directly from
Prometheus Setup!
- As per usual, we can handle this through Docker and Docker Compose
- You may want to add your various exporters to the same Docker Compose file, as deemed appropriate
services:
  prometheus:
    image: prom/prometheus
    ports:
      - 9090:9090
    volumes:
      - ./prometheus.yml:/etc/prometheus/prometheus.yml
      - ./prom_data:/prometheus
    user: 1000:1000
Configuring Prometheus
Because Prometheus pulls data to it, it needs a configuration file to tell it what it should be pulling and how often
This should be in the same folder as your
docker-compose.ymlfile (at least as set up there)A highly basic configuration might initially look like:
global:
  scrape_interval: 15s #How frequently to scrape
  evaluation_interval: 15s # for rules/alerts

scrape_configs:
  - job_name: 'prometheus' # Name of the scraping job
    static_configs:
      - targets: ['localhost:9090'] # API endpoint
Exporter 1: The Node Exporter
- Sometimes you just want to be able to monitor the overall system (or systems) where code in running
- This is where the node exporter comes in!
- We can run it in a container, and thus just add it to our docker
stack
- Does require a few extra settings to ensure we get the system metrics, not the container metrics
services:
  node-exporter:
    image: quay.io/prometheus/node-exporter
    command:
      - '--path.rootfs=/host'
    network_mode: host
    pid: host
    restart: unless-stopped
    volumes:
      - '/:host:ro,rslave'
Exporter 1: Adding to Config
All launching the exporter container does is make the metrics available, we still need to tell Prometheus to grab these new values
Under
scrape_configs, just need to add a field:... scrape_configs: ... - job_name: 'vm_node' static_configs: - targets: ['example.advde:9100']
Exporter 1: Visualization
- We can access this information directly through the Prometheus dashboard on port 9090
- But an even nicer approach is to take advantage of Grafana
- In your Grafana instance:
- Add a new data source, and select Prometheus
- Enter in the URL, but nothing else needs to change (test it! It should work!)
- Now, we could build our own dashboard with this
information, but an even nicer use-case is to leverage something someone
else has made
- Go to dashboards, select new and then select Import
- In the Grafana Dashboard ID field, enter
1860and Load!
Exporter 2: The Postgres Exporter
What if we want more details about specifically what is happening in our database?
There exists a Postgres exporter!
services:
  postgres-exporter:
    image: prometheuscommunity/postgres-exporter
    environment:
      DATA_SOURCE_NAME: "postgresql://user:pass@host:port/dbname?sslmode=disable"
    ports:
      - 9187:9187
Exporter 2: Adding to Config
Don’t forget to update the Prometheus config!
...
scrape_configs:
  ...

  - job_name: 'postgres'
    static_configs:
      - targets: ['example.advde:9187']
Exporter 2: Visualization
- There is a pre-built dashboard for the Postgres-Exporter as well, but it requires a bit of adaption
- I have made the necessary tweaks and offer the configuration JSON to you here
- You can still go to create a new dashboard, import, but then either copy and paste in the JSON or upload the file
Exporter 3: Airflow
Getting Airflow metrics into Prometheus requires a bit of a middle step
Airflow has built in ways of exporting metrics to a system called StatsD
We can effectively turn this on, and then set up a statsd-exporter that makes metrics available in a Prometheus format
Easiest way to turn on is to set 3 environment variables in Airflow’s
docker-compose.yml:AIRFLOW__METRICS__STATSD_ON: 'true' AIRFLOW__METRICS__STATSD_PORT: 9125 AIRFLOW__METRICS__STATSD_HOST: 'example.advde'
Exporter 3: StatsD Exporter Setup
The StatsD Exporter benefits from a cheat-sheet for how it can translate from statsd to Prometheus names
- Grab from here
and copy/paste or download and move to
statsd_mapping.ymlin same location asprometheus.yml
- Grab from here
and copy/paste or download and move to
Then we can set up the exporter in Docker Compose
services:
  statsd-exporter:
    image: prom/statsd-exporter
    ports:
      - 9102:9102 # Where to access metrics
      - 9125:9125 # Incoming metrics
      - 9125:9125/udp
    volumes:
      - ./statsd_mapping.yml:/tmp/statsd_mapping.yml
    command:
      - '--statsd.mapping-config=/tmp/statsd_mapping.yml'
Exporter 3: Prometheus Config
There is nothing magical about the new Prometheus config:
...

scrape_configs:
  ...
  - job_name: 'airflow'
    static_configs:
      - targets: ['example.advde:9102']
Exporter 3: Visualization
- Unfortunately, all of the dashboards I’ve found for this so far are either broken or terrible
- I’ll see if I can’t put one together for next week that is more useful
Work Time!
Your Turn
- The rest of the evening is set aside for you to work on your projects
- Deadline is Tuesday!
- Make sure before you leave tonight you, at the very least have reliable event snapshots occurring