Misc Logs
Jed Rembold
August 6, 2025
Announcements
- Milestone 5 due!
- If you haven’t gotten it in yet, please make sure you get it in tonight or by tomorrow night
- Optional Milestone 6
- Blue line actually being activated!
- How will congestion and traffic flow be affected?
- Last weekly reflections today (if you haven’t already for this week)!
- Deadline for last documentation round is next Wednesday night
Tonight
- Metrics
- Prometheus
- Postgres Exporter
- Node Exporter
- Airflow Exporter
- Prometheus
- Logs
- OpenLineage?
- Project Work
Some Last Metrics
Exporter 3: Airflow
Getting Airflow metrics into Prometheus requires a bit of a middle step
Airflow has built in ways of exporting metrics to a system called StatsD
We can effectively turn this on, and then set up a statsd-exporter that makes metrics available in a Prometheus format
Easiest way to turn on is to set 3 environment variables in Airflow’s
docker-compose.yml:AIRFLOW__METRICS__STATSD_ON: 'true' AIRFLOW__METRICS__STATSD_PORT: 9125 AIRFLOW__METRICS__STATSD_HOST: 'example.advde'
Exporter 3: StatsD Exporter Setup
The StatsD Exporter benefits from a cheat-sheet for how it can translate from statsd to Prometheus names
- Grab from here
and copy/paste or download and move to
statsd_mapping.ymlin same location asprometheus.yml
- Grab from here
and copy/paste or download and move to
Then we can set up the exporter in Docker Compose
services:
  statsd-exporter:
    image: prom/statsd-exporter
    ports:
      - 9102:9102 # Where to access metrics
      - 9125:9125 # Incoming metrics
      - 9125:9125/udp
    volumes:
      - ./statsd_mapping.yml:/tmp/statsd_mapping.yml
    command:
      - '--statsd.mapping-config=/tmp/statsd_mapping.yml'
Exporter 3: Prometheus Config
There is nothing magical about the new Prometheus config:
...

scrape_configs:
  ...
  - job_name: 'airflow'
    static_configs:
      - targets: ['example.advde:9102']
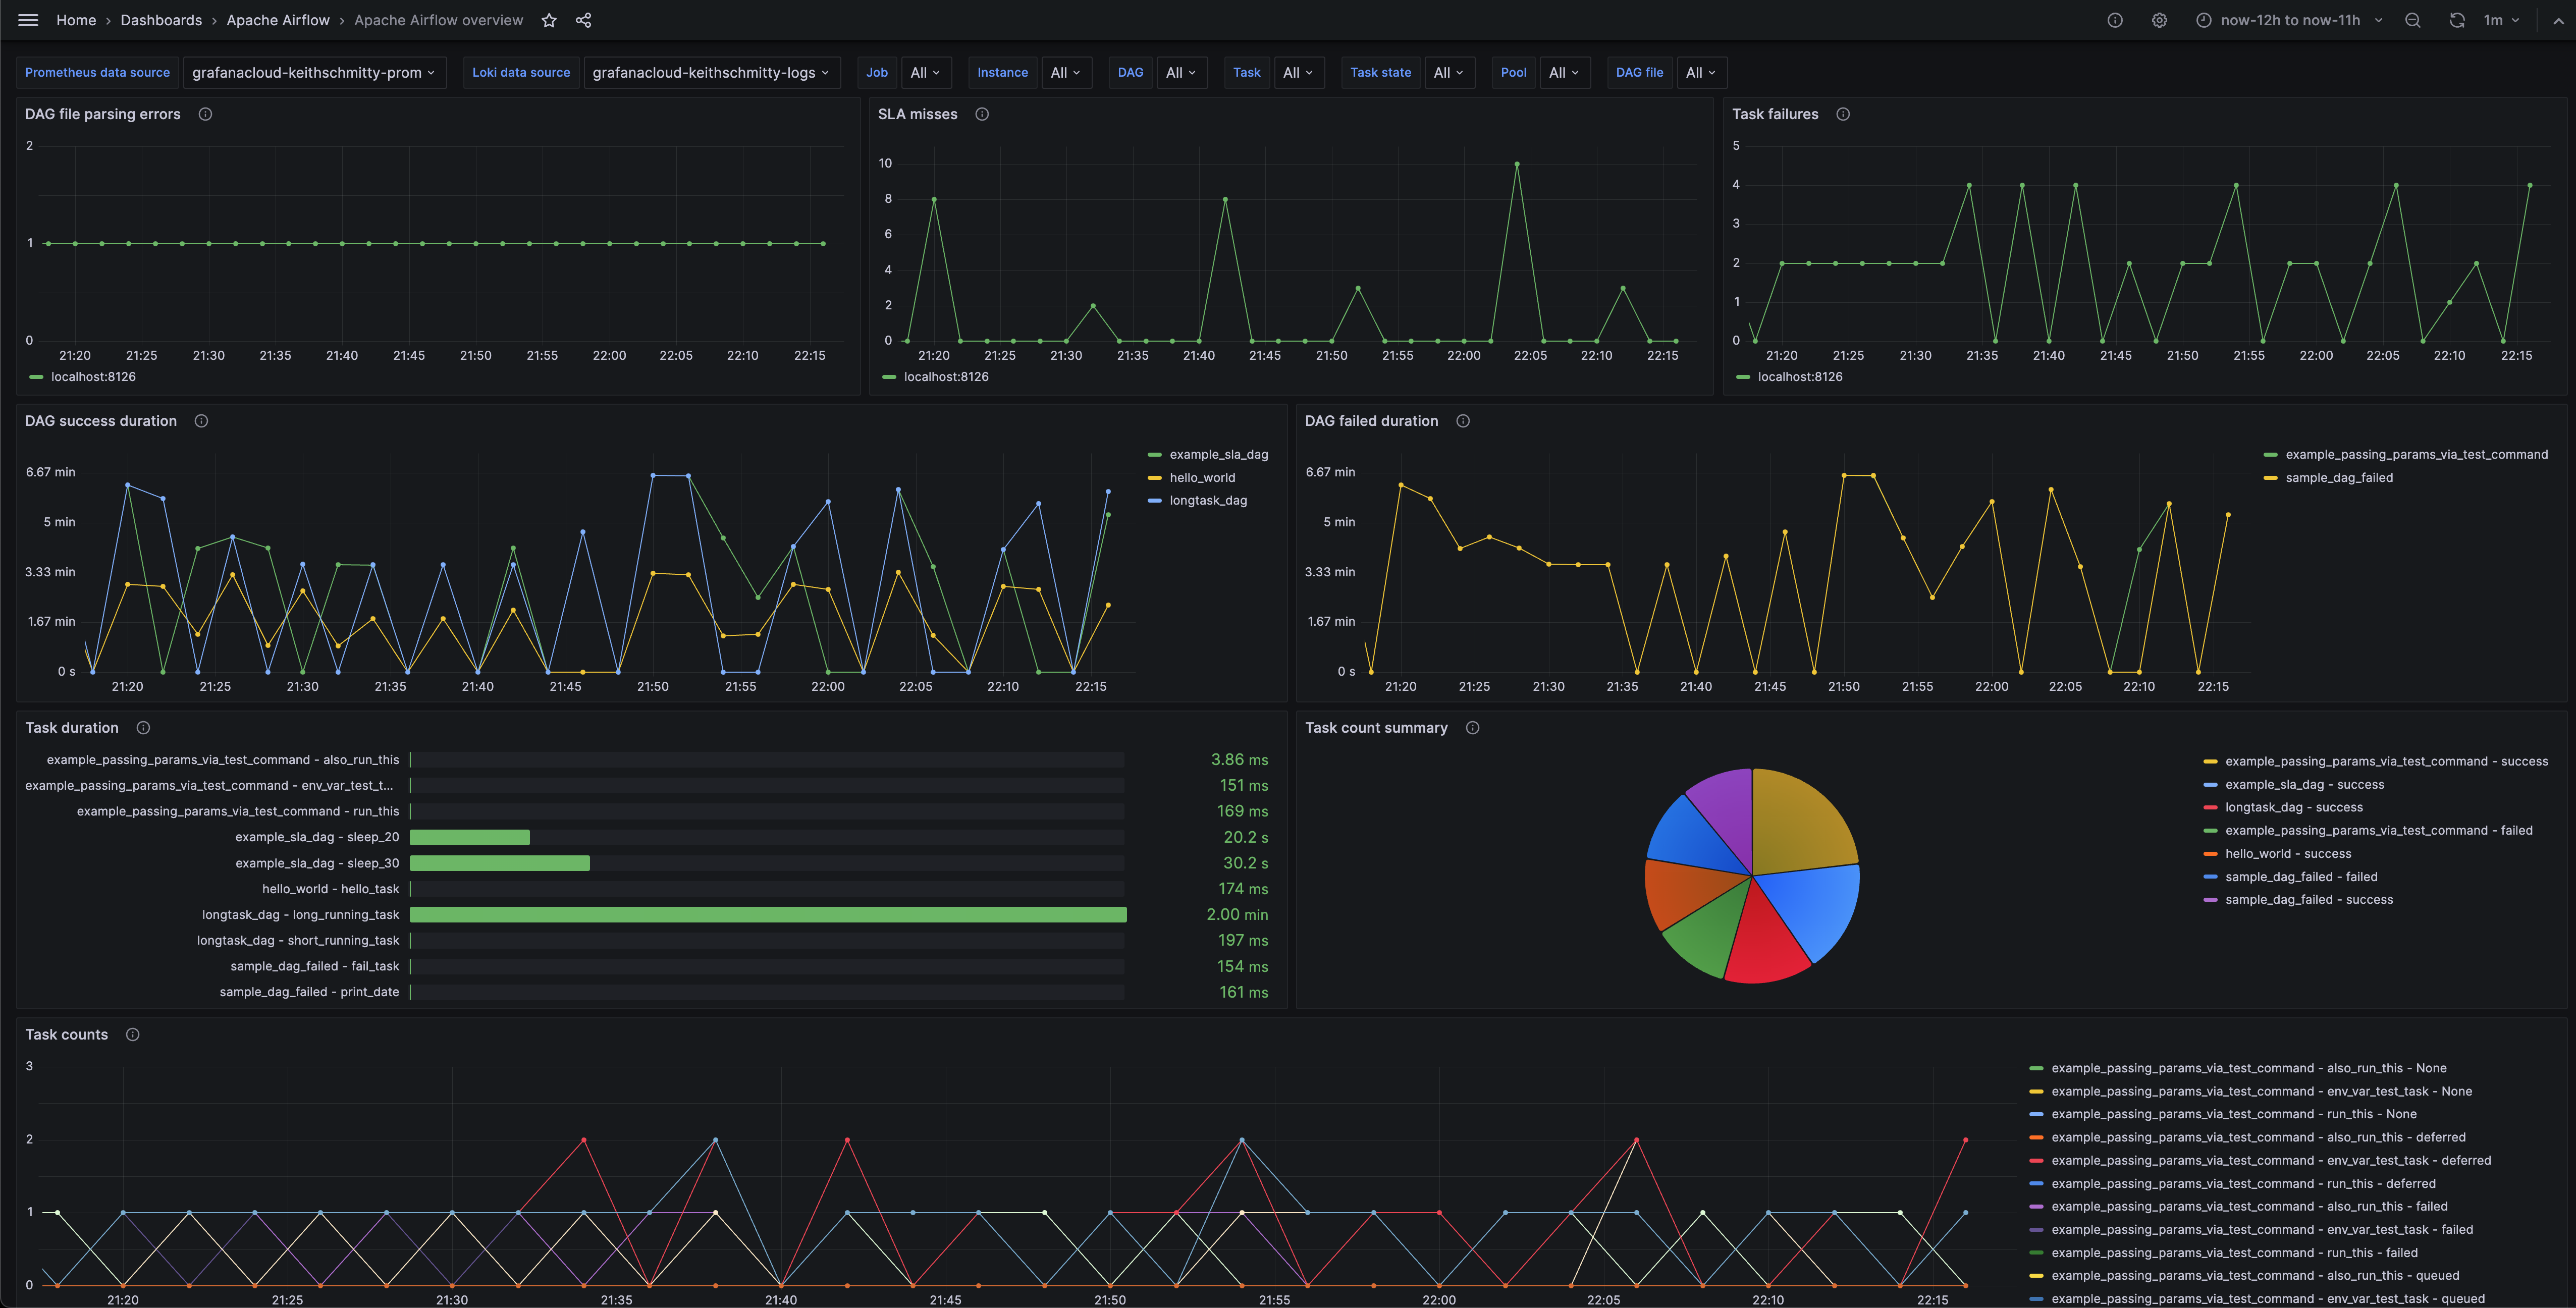
Exporter 3: Visualization
- Unfortunately, all of the dashboards I’ve found easily available for this so far are either broken or terrible
- I have found some nice screenshots though that you could try to mimic
Logs
Logging Basics
- As mentioned last week, logs usually serve to answer the why? portion of observability
- Can be semi-structured or structured
- Usually include a timestamp, as well as any pertinent information that might help someone understand why something has gone wrong
- Incredibly common in most any long-running software
- Frequently categorizes at different levels:
- DEBUG, INFO, WARNING, ERROR, CRITICAL
Combining Logs
- For complex systems integrating many pieces of software, each piece
of software usually has its own logs, stored it its own location
- This is frequently not ideal for troubleshooting: it makes it difficult to triage across processes
- Logs stored only locally can make it difficult to access remotely as well
- As such, it can be useful to have software that gathers, organizes, and makes logs across many services searchable and discoverable
Combining Software
- Open Source
- ELK Stacks (Elasticsearch, Logstash, Kibana)
- Graylog
- SigNoz
- Loki
- Commercial
- Splunk
- DataDog
- Papertrail
- New Relic
Loki
- Given that we have already been using Grafana, Loki might be a popular option
- Usually comprised of two services:
- Promtail does the log acquisition and then sends off to a
central storage location
- Very similar to a Prometheus exporter
- Loki itself serves as a central source, indexing, and query
engine
- Similar to Prometheus itself, but for logs
- Stores logs to disk or S3
- Only indexes the labels, and not the full text of the log, making it space efficient
- Promtail does the log acquisition and then sends off to a
central storage location
- Seemlessly integrates with Grafana for querying and visualizations
Deployment
As per usual, we can deploy both from Docker Compose
services:
  loki:
    image: grafana/loki:latest
    ports:
      - "3100:3100"
    volumes:
      - ./loki-config.yaml:/etc/loki/loki-config.yaml

  promtail:
    image: grafana/promtail:latest
    volumes:
      - ./promtail-config.yaml:/etc/promtail/promtail-config.yaml
      - /var/log:/var/log
      - /other_log_sources:/mnt/other_log_sources
Loki Config
You shouldn’t need to alter the default Loki config at all. The defaults direct from the website are:
auth_enabled: false

server:
  http_listen_port: 3100
  grpc_listen_port: 9096
  log_level: debug
  grpc_server_max_concurrent_streams: 1000

common:
  instance_addr: 127.0.0.1
  path_prefix: /tmp/loki
  storage:
    filesystem:
      chunks_directory: /tmp/loki/chunks
      rules_directory: /tmp/loki/rules
  replication_factor: 1
  ringc:
    kvstore:
      store: inmemory

query_range:
  results_cache:
    cache:
      embedded_cache:
        enabled: true
        max_size_mb: 100

limits_config:
  metric_aggregation_enabled: true

schema_config:
  configs:
    - from: 2020-10-24
      store: tsdb
      object_store: filesystem
      schema: v13
      index:
        prefix: index_
        period: 24h

pattern_ingestor:
  enabled: true
  metric_aggregation:
    loki_address: localhost: 3100

ruler:
  alertmanager_url: http://localhost:9093

frontend:
  encoding: protobuf
Promtail Config
You would probably mostly want to add new scrape jobs to the default Promtail config
server:
  http_listen_port: 9080
  grpc_listen_port: 0

positions:
  filename: /tmp/positions.yaml

clients:
  url: http://loki:3100/api/v1/push

scrape_configs:
  - job_name: system
    static_configs:
    - targets:
        - localhost
      labels:
        job: varlogs
        __path__: /var/log/*log
Kicking Things Off
- Starting up the Docker Compose stack should bring everything up
- Promtail will automatically find existing logs, and will monitor for newly appearing logs
- You can then add a Loki source in Grafana
- If you go to the log explorer, you should be able to start poking around all of your logs, centralized and searchable in one location!
- These can of course also be included in dashboards
Interactions with Airflow
- Loki could interact with Airflow in a few ways:
- Assign Promtail to scrape the local file logs
- This feels the easiest to me, but I can’t seem to get it working
- Install and set up the Airflow
Grafana Loki Provider
- This bypasses Promtail and sends logs also directly to Loki
- Use Grafana
Alloy
- A newer, unified telemetry collector
- I haven’t really gotten a chance to try this out
- Assign Promtail to scrape the local file logs
OpenLineage
Lineage
- We’ve talked a few times about how lineage is the ability to trace the path of data through a pipeline
- When we introduced Airflow’s
assets, we reinforced how we could explicitly follow this - This is fine if Airflow governed tasks are the only things touching for data, but what if other software is also creating, modifying, or deleting your data?
- Then we need a more global tool to track all of the possible
lineages
- OpenLineage is one such specification of how to go about doing so
The Implementation
- Marquez is one such implementation of the openlineage
standard
- Serves as a central reference point where various services can report their lineage data
- Stores metadata about jobs, datasets, runs, etc
- Offers an API, so that other services can access this information
- Makes everything visible to users through a web UI
Caveats
- Marquez can interface easily with Airflow, but some things are
currently still less than ideal (imho)
- Other parts though are really slick
- Marquez will automtically identify data sources
from many Airflow operators
SQLExecuteQueryOperator, andPostgresOperatorare two main ones- It will not currently automatically identify data sources access through Python operators
- Despite Airflow’s Assets and OpenLineage’s datasets being
essentially the same thing, Airflow assets will not currently
automatically map to OpenLineage datasets
- This is really unfortunate in my opinion, but work is apparently ongoing to rectify this
Installation
Marquez prefers you use some helper scripts to launch its services (which uses Docker Compose under the hood)
Need to checkout the Git repo and then enter the repo:
git clone https://github.com/MarquezProject/marquez && cd marquezStart the services (both the server, web UI, and database for storage) with:
./docker/up.sh --db-port 2345- Need the
--db-portportion to ensure the new database doesn’t conflict with your warehouse
- Need the
Can access the web UI then at
localhost:3000
Connecting Airflow
It is actually trivially easy to set up Airflow to talk to Marquez
Set two environmental variables in your Airflow Docker Compose
...
  AIRFLOW__OPENLINEAGE__TRANSPORT: '{"type": "http", "url": "http://localhost:5000", "endpoint": "api/v1/lineage"}'
  AIRFLOW__OPENLINEAGE__NAMESPACE='my-team-airflow-instance'
...
Newer Airflow Docker images already ship with the necessary providers
Restart your Airflow stack and they are connected!
Work Time!
Next Week
- The plan for next week is as follows:
- First 30 minutes for evals and general discussion of the semester
- Pizza
- Open wandering between “stations”:
- Two people from each group should man their station at a times
- We’ll rotate every 15 minutes
- Stations:
- Airflow
- Data Warehousing
- Documentation
- Milestone 2
- Milestone 3
- Milestone 4
- Milestone 5
Your Turn
- The rest of the evening is set aside for you to work on your projects if you still need
- Even if you have Milestone 5 in, remember you have documentation due next week!