 .
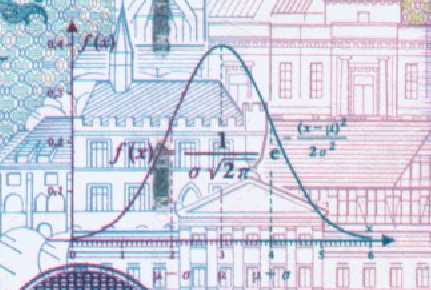
The shape of the curve is like the silhouette of a bell, hence the name
"the bell curve":
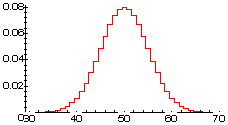
- The number of heads obtained in 100 tosses of a coin (even if the coin is moderately biased): Count the number of heads in each of many 100-toss trials; make a histogram of the number of heads obtained in each trial. Do it long enough, the histogram will be approximately the normal curve, except (for a fair coin) shifted right 50 units, and stretched horizontally by a factor of 5. Also, the histogram will be a bit "jaggy" since one can obtain 50 or 51 or 52 heads in a 100-toss trial, but not 51.4 heads:
- The total number of spots seen in 50 rolls of a die (similar to above).
- Choose 200 people randomly from the Philadelphia population. Repeat 99 more times to get 100 different samples of 200 people each. Find the average weights of the 200 people in each sample, to get 100 different averages. Make a histogram of those averages. The curve will be approximately the normal curve, though shifted right (I'd guess about 140 pounds worth) and stretched horizontally by a factor of about, say, 5 lbs [averages tend to cancel out extremes of variation].
- For example, if a random sample of 500 Philadelphia voters shows 74% will vote for Candidate A, there is a chance that this sample is completely non-representative of the overall Philadelphia voting population. In fact, if the sample was really random (everone in Philly having an equal chance of being picked for the sample), the chance of the sample not representing the population reasonably well is low...
- Another example: I test 200 tires from a production run, by wearing them out, to see how many miles they last. I select those 200 at random from the entire production run. I can't test the entire production run (because I can't sell tested, i.e. worn-out tires). Again, my sample may be unrepresentative, but the normal curve will give me a way to estimate the likely margin of error.

This last fact (#4) is why the normal curve is so important to statisticians.
Many, many calculations about chance can be approximated very well with
the normal curve. This is particularly important when looking at
a sample from a population (of people, cats, or computer chips).
and the punchline
the normal curve is a tool a statistician can use to tell how
far the sample is likely to be off from the overall population, i.e. how
big a "margin of error" there is likely to be in his/her poll.


 willamette.edu