H445/131
DIMENSIONS OF THE POSTWAR ECONOMIC MIRACLE
| GNP | Growth Rate | ANNUAL AVG | Per Capita Income |
| 1955-60 | 1.9x | 8.8 | $200 (1955) |
| 1960-65 | 2.1x | 10.1 | |
| 1965-70 | 2.5x | 12.1 | $2300 (1970) |
| 1975 | $300 millionGDP | ||
| 1978 | $450 million | $19,642 (0vertakes US) | |
| 1988 | 4.2% |
More GDP/Comparative Figures: http://kushnirs.org/macroeconomics/gdp/gdp_japan.html
For 2015:
| Population | 127.0 million | 2015 |
| GDP | $4.383 billion | 2015 |
| GDP growth | 1.2% | 2015 |
| Inflation | 0.8% | 2015 |
2106:
Japan’s economy grew more than previously estimated in the fourth quarter as capital expenditure rose at its fastest rate in almost three years — welcome news for policymakers as they begin to discuss how to wind down years of massive stimulus.
The economy grew an annualized 1.2 percent in October-December, less than the median estimate for 1.6 percent annualized growth but more than the preliminary reading of a 1 percent annualized expansion.
Interesting to note:
During 1970-2015 GDP per capita in Japan rose by 32 589.0 US dollars (in 17.0 times) to 34 629.0 US dollars. The average annual growth of GDP per capita in current prices was 724.2 US dollars or 6.5%.
How did Japan Grow?
1st Wave = Manufacturing
Optics -- cameras, binoculars, telescoptes, etc.
Electronics--receivers, amps, speakers, radios, TVs,
Automobiles
Steel
Shipbuilding
Petrochemicals
2nd Wave = tertiary, knowledge-intensive, service industries
trade, transportation, finance, insurance, management, real estate,
information retrieval systems
computer chips, VCRs, handi-cams, big screens, etc.
SOME KEY FACTORS
Role of Historical Imperatives (War, Occupation, Zaibatsu, Dodge Line,Korean War)
Role of Technology
High rate domestic savings
High Rate Investment in R&D
Low Rate of Defense Expenditures ("Free Ride")
Quality of Labor force--JES
Long-Range Planning
"Administrative Guidance"
Role of Education
See H 131 JohnsonEconMiracle.pdf on WISE
JAPANESE ECONOMY IN THE 1950s AND 60s
In 1950, the per capita income of Japan was equal to that of Ethiopia and Somalia and 40 percent less than India. People were still dying of starvation.
Photographs at Yasukini Shrine from the mid 1940s show families standing in front of shop windows "looking longingly" at toasters and refrigerators. In the 1950s, U.S. Secretary of State John Foster Dulles said, Japan "should not expect to find a big U.S. market because the Japanese don't make things we want."
In the 1950s and 1960s, Japanese bought black and white televisions, washing machines with ringers and ice candy from vendors roaming the streets on bicycles. Many people went out to the movies for entertainment.
Throughout the postwar period, Japan's economy continued to boom, with results far outstripping expectations. Japan rapidly caught up with the West in foreign trade, gross national product (GNP), and general quality of life. These achievements were underscored by the 1964 Tokyo Olympic Games and the Osaka International Exposition (Expo '70) world's fair in 1970. [Source: Library of Congress]
“In his 1979 book Japan as Number One Harvard’s Ezra Vogel proclaimed that 'Japan has dealt more successfully with more of the basic problems of post-industrial society than any other country.'” Perry Anderson wrote in the London Review of Books, “The Japanese themselves," he said, "had been too modest about their achievements. It was time they realised that in the overall effectiveness of their institutions, they were ‘indisputably number one’ and it was time, too, that Americans woke up to the fact, and put their own house in order. Post-bubble, the book is no doubt remaindered in Japan. But at the time, Vogel’s flattery electrified sales. “ [Source: Perry Anderson, London Review of Books, February 9, 2012]
Rapid Growth in Japan in the 1960s
In 1960, Prime Minister Hayato Ikeda, regarded as Japan's most charismatic postwar prime minister, challenged Japan to double its income in the next decade. Under the Income Doubling Plan consumption was boosted by cutting taxes, bolstering welfare, raising farm prices and reducing income equality. This ushered in a long period of growth that didn't stall until the oil crisis of 1973. The 58 month period of sustained growth between November 1965 and July 1970 is known as the “Izanagi” boom. Japan became the world’s second largest economy in 1968.
Through the 1960s, Japan had a growth rate of 11 percent (compared to 4.6 percent in West Germany and 4.3 percent in the United States and comparable to the growth rates China has achieved in the 1990s and 2000s), fueled by vigorous investment of private industry in new plants and equipment; a high rate of saving by Japanese households, which provided banks with funds for investment; and the availability of an abundant labor force with a high level of education.
Many ordinary Japanese aspired to get their hands on the "three Cs"—a car, an air conditioner and a color TV. Between 1965 and 1970 the number of households that owned a car jumped from 1 in 20 to 1 in 5. By 1970, 19 out of 20 owned a television.
Protectionism by the United States allowed Japanese companies stop focusing on producing consumer goods and concentrate more on making big things like cars. By 1970, Japan was the third largest industrial nation in the world after the United States and the Soviet Union. Spurred by the Income-Doubling plan of 1960, Japan became the world’s second-largest economy in the early1970s, strong enough to weather the energy crisis and oil shock of the mid-1970s.
**********************
Comparative Note with Contemporary Policy Implications:
The lessons from Europe and Japan are that austerity, per se, is not the way to move to a sustainable fiscal stance. Rather, the US economy needs a combination of tax reform to boost growth and legislation enacted now to stabilize the future growth of outlays on entitlement programs. That approach would slow overall spending growth enough to stabilize the debt-to-GDP ratio over the next five years. After 2018, sustained economic growth and slower growth of government spending would put the debt-to-GDP ratio on a negative long-run path. Holding the deficit steady at $500 billion per year would achieve this goal of stabilizing and then reducing America’s debt-to-GDP ratio.
Japan’s experience cautions that a monetary policy aimed at avoiding deflation coupled with a fiscal policy aimed at sustaining growth of domestic demand is the best long-run stance to achieve a sustainable level of debt and growth. America has done the monetary part; now it is time for the fiscal part.
From: Postwar Japan Link: http://aboutjapan.japansociety.org/content.cfm/postwar_japan_1952-1989
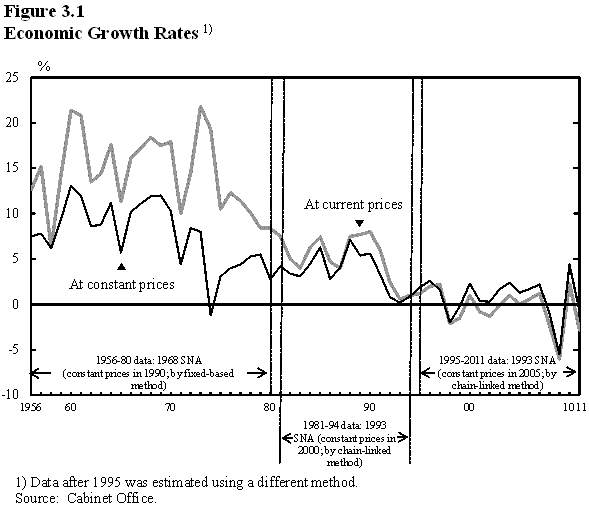
This stability in turn encouraged what has often been called Japan’s “Economic Miracle.” In simplest terms, this referred to the fact that Japan’s Gross Domestic Product (GDP) increased by a rather amazingly large average of 9.2% between 1956 and 1973, and even after the world recession caused by the rise in oil prices in the 1970’s, still grew by an average 4.1% up through 1989. Helped by record outputs of such manufactured goods as ships, electronic equipment and cars, the “economic miracle” quickly transformed this small island nation into one of the world’s top economic giants. Exchange rates may have made the figure somewhat misleading, but by 1987, Japan had a higher per capita GDP than the United States. Certainly a poor country was now statistically rich.
In broader terms, the term “economic miracle,” however simplistic, also reflected the fact that enormous social changes took place with relatively little disruption. During this period, the population of Japan grew from 85.8 million people to over 123 million. The percentage of Japanese living in rural areas dropped from roughly 50% of the population to perhaps (depending on how “rural” is defined) 15%; the percentage of full time farmers dropped even more. The number of traditional ie or multigenerational, patriarchic families remained, but their percentage also dropped significantly in relation to the total number of Japanese families. As Japan’s admirers (Chrysanthemum Clubbers) were quick to point out, these changes were accompanied by an increase in real incomes, a relatively narrow gap between rich in poor, a decrease in crime, high literacy and low divorce. All this, they claimed, deserved to be called a “miracle.”
The Myth of Japan’s Failure
By EAMONN FINGLETON
Published: January 6, 2012
DESPITE some small signs of optimism about the United States economy, unemployment is still high, and the country seems stalled.
Time and again, Americans are told to look to Japan as a warning of what the country might become if the right path is not followed, although there is intense disagreement about what that path might be. Here, for instance, is how the CNN analyst David Gergen has described Japan: “It’s now a very demoralized country and it has really been set back.”
But that presentation of Japan is a myth. By many measures, the Japanese economy has done very well during the so-called lost decades, which started with a stock market crash in January 1990. By some of the most important measures, it has done a lot better than the United States.
Japan has succeeded in delivering an increasingly affluent lifestyle to its people despite the financial crash. In the fullness of time, it is likely that this era will be viewed as an outstanding success story.
How can the reality and the image be so different? And can the United States learn from Japan’s experience?
It is true that Japanese housing prices have never returned to the ludicrous highs they briefly touched in the wild final stage of the boom. Neither has the Tokyo stock market.
But the strength of Japan’s economy and its people is evident in many ways. There are a number of facts and figures that don’t quite square with Japan’s image as the laughingstock of the business pages:
• Japan’s average life expectancy at birth grew by 4.2 years — to 83 years from 78.8 years — between 1989 and 2009. This means the Japanese now typically live 4.8 years longer than Americans. The progress, moreover, was achieved in spite of, rather than because of, diet. The Japanese people are eating more Western food than ever. The key driver has been better health care.
• Japan has made remarkable strides in Internet infrastructure. Although as late as the mid-1990s it was ridiculed as lagging, it has now turned the tables. In a recent survey by Akamai Technologies, of the 50 cities in the world with the fastest Internet service, 38 were in Japan, compared to only 3 in the United States.
• Measured from the end of 1989, the yen has risen 87 percent against the U.S. dollar and 94 percent against the British pound. It has even risen against that traditional icon of monetary rectitude, the Swiss franc.
• The unemployment rate is 4.2 percent, about half of that in the United States.
• According to skyscraperpage.com, a Web site that tracks major buildings around the world, 81 high-rise buildings taller than 500 feet have been constructed in Tokyo since the “lost decades” began. That compares with 64 in New York, 48 in Chicago, and 7 in Los Angeles.
• Japan’s current account surplus — the widest measure of its trade — totaled $196 billion in 2010, up more than threefold since 1989. By comparison, America’s current account deficit ballooned to $471 billion from $99 billion in that time. Although in the 1990s the conventional wisdom was that as a result of China’s rise Japan would be a major loser and the United States a major winner, it has not turned out that way. Japan has increased its exports to China more than 14-fold since 1989 and Chinese-Japanese bilateral trade remains in broad balance.
Clearly the question of what has really happened to Japan is of first-order geopolitical importance. In a stunning refutation of American conventional wisdom, Japan has not missed a beat in building an ever more sophisticated industrial base. That this is not more obvious is a tribute in part to the fact that Japanese manufacturers have graduated to making so-called producers’ goods. These typically consist of advanced components or materials, or precision production equipment. They may be invisible to the consumer, yet without them the modern world literally would not exist. This sort of manufacturing, which is both highly capital-intensive and highly know-how-intensive, was virtually monopolized by the United States in the 1950s and 1960s and constituted the essence of American economic leadership.
Japan’s achievement is all the more impressive for the fact that its major competitors — Germany, South Korea, Taiwan and, of course, China — have hardly been standing still. The world has gone through a rapid industrial revolution in the last two decades thanks to the “targeting” of manufacturing by many East Asian nations. Yet Japan’s trade surpluses have risen.
Japan should be held up as a model, not an admonition. If a nation can summon the will to pull together, it can turn even the most unpromising circumstances to advantage. Here Japan’s constant upgrading of its infrastructure is surely an inspiration. It is a strategy that often requires cooperation across a wide political front, but such cooperation has not been beyond the American political system in the past. The Hoover Dam, that iconic project of the Depression, required negotiations among seven states but somehow it was built — and it provided jobs for 16,000 people in the process. Nothing is stopping similar progress now — nothing, except political bickering.
From Bubbles Link, http://www.willamette.edu/~rloftus/H445BubblesLessons.html
Another thing Japan may be innovating is the role of so-called
"smart cities"--see this link!
See where Japan Ranks in the Top 10 Economies in the World:
Note: This list is based on IMF’s World Economic Outlook Database, October 2016. Select data is from the CIA World Factbook.
1. United States
The U.S. economy remains the largest in the world in terms of nominal GDP. The $18.5 trillion U.S. economy is approximately 24.5% of the gross world product. The United States is an economic superpower that is highly advanced in terms of technology and infrastructure and has abundant natural resources. However, the U.S. economy loses its spot as the number one economy to China when measured in terms of GDP based on PPP. In these terms, China’s GDP is $21.3 trillion and the U.S. GDP is $18.5 trillion. However, the U.S. is way ahead of China in terms of GDP per capita (PPP) – approximately $57,294 in the U.S. versus $15,423 in China.
2. China
China has transformed itself from a centrally-planned closed economy in the 1970s to a manufacturing and exporting hub over the years. Since it initiated market reforms in 1978, the Asian giant has achieved economic growth averaging 10% annually (though it’s slowed recently) and, in the process, lifted almost half of its 1.3 billion population out of poverty and become the undisputed second-largest economy on Earth. The Chinese economy has already overtaken the U.S. economy in terms of GDP, based on another measure known as purchasing power parity (PPP), and is estimated to pull ahead of the U.S. steadily in the following years. However, the difference between the economies in terms of nominal GDP remains large with China's $11.3 trillion economy. The Chinese economy has long been known for its strong growth, a growth of over 7% even in recent years. However, the country saw its exports projected to grow only by 1.9% in 2016, and total GDP growth has gone down to 6.5% and is projected to slow to 5.8% by 2021. The country's economy is propelled by an equal contribution from manufacturing and services (45% each, approximately) with a 10% contribution by the agricultural sector. In its October 2012 World Economic Outlook report, the International Monetary Fund (IMF) projected that China’s gross domestic product (GDP) would outpace that of the U.S. as early as 2017. The Organization for Economic Cooperation and Development (OECD) forecasts China's GDP (based on 2005 PPP) at $15.26 trillion for 2016, exceeding the forecasted U.S. GDP of $15.24 trillion for the very first time.
3. Japan
Japan’s economy currently ranks third in terms of nominal GDP, while it slips to fourth spot when comparing the GDP by purchasing power parity. The economy has been facing hard times since 2008, when it first showed recessionary symptoms. Unconventional stimulus packages combined with subzero bond yields and weak currency have further strained the economy (for related reading, see: Japan's Economy Continues to Challenge Abenomics). Economic growth is once again positive, to just over 0.5% in 2016; however it is forecasted to stay well below 1% during the next six years. The nominal GDP of Japan is $4.73 trillion, its GDP (PPP) is $4.93 trillion, and its GDP (PPP) per capita is $38,893.
4. Germany
Germany is Europe’s largest and strongest economy. On the world scale, it now ranks as the fourth largest economy in terms of nominal GDP. Germany’s economy is known for its exports of machinery, vehicles, household equipment, and chemicals. Germany has a skilled labor force, but the economy is facing countless of challenges in the coming years ranging from Brexit to the refugee crisis (for related reading, see: 3 Economical Challenges Germany Faces in 2016). The size of its nominal GDP is $3.49 trillion, while its GDP in terms of purchasing power parity is $3.97 trillion. Germany’s GDP (PPP) per capita is $48,189, and the economy has moved at a moderate pace of 1-2% in recent years and is forecasted to stay that way.
5. United Kingdom
The United Kingdom, with a $2.65 trillion GDP, is currently the world’s fifth largest. Its GDP in terms of PPP per capita is $42,513. The economy of the UK is primarily driven by services, as the sector contributes more than 75% of the GDP. With agriculture contributing a minimal 1%, manufacturing is the second most important contributor to GDP. Although agriculture is not a major contributor to GDP, 60% of the U.K.’s food needs is produced domestically, even though less than 2% of its labor force is employed in the sector. After the referendum in June 2016 when voters decided to leave the European Union, economic prospects for the UK are highly uncertain, and the UK and France may swap places. The country will operate under EU regulations and trade agreements for two years after the formal announcement of an exit to the European Council, in which time officials will work on a new trade agreement. Economists have estimated that Brexit could result in a loss of anywhere from 2.2-9.5% of GDP long term, depending on the trade agreements replacing the current single market structure. The IMF, however, projects growth to stay between 1.05-1.09% in the next five years.
Read more: The World's Top 10 Economies | Investopedia http://www.investopedia.com/articles/investing/022415/worlds-top-10-economies.asp#ixzz4eW2ERCIg
Follow us: Investopedia on Facebook