|
The picture is a Mandelbrot fractal given by the logistic equation
zn+1 = fp(zn) = p(1 - zn) zn
with the initial value z0= 0.1 over the rectangular area defined by xmin = -2.5, xmax = 4.5, ymin = -2.5, ymax = 2.5. If the critical point z0= 0.5 of fp is used for the initial value, the "figure eight" portion becomes nearly (but not quite) symmetric about its intersection point:
When the parameter p is a real number between 0 and 4, the logistic equation is used to simulate the population dynamics of certain species in controlled environments. For example, if p = 2.5, it is easy to show that the logistic sequence zn converges to 0.6 for any initial value z0 strictly between 0 and 1. If z4 = 0.6061, we interpret it as: The population reaches 60.61% of the "carrying capacity" (or the maximum sustainable population) at "generation" 4.
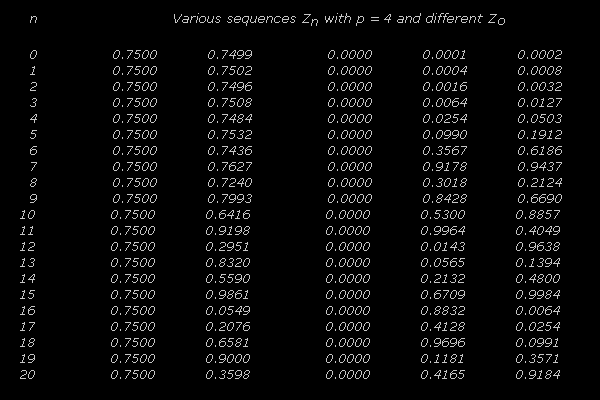
The middle horizontal line comprises real parameters p and its intersection with the right "antenna" of either fractal is the region of interest in chaos theory. It is an interval [α, 4] of real numbers with α ≈ 3.57. In 1974, Robert May observed that if a parameter p is chosen from the interval, the logistic sequence frequently behaves like a random or "chaotic" sequence. The following table shows three examples of chaotic sequences.

In particular, it shows the effect of a small perturbation like 0.0001 on other growth patterns. For example, after n = 10 or so, the behaviors of the sequences with zo = 0.0000 and zo = 0.0001 become completely different and the "perturbed" sequence appears more like a random sequence. The totally different outcome triggered by the small perturbation shows an example of the "butterfly effect," which is one of the characteristics of "chaos."
Return to  Gallery I
  Fractal Home
  Gallery II

|


 Gallery I
  Fractal Home
  Gallery II
