Lab 8: The Mandelbrot Set
CS 145: Images and Imagination,
Spring 2014
Final submission is due Friday, April 25 before class.
This lab is worth 20 points
See policy page for late penalties.
The main goals of this lab are to:
The while-loop is a more general type of loop than the for-loop (a for-loop can always be replaced by a while-loop but not vice versa). There are actually two versions: "while" and the "do-while":
"while": the condition is checked at the beginning. The statements in the body execute 0 or more times.
|
|
Any for-loop can be written as a while-loop. For example: the following for-loop
|
|
While-loops are much more general than for-loops, e.g. they are useful when one doesn't know ahead of time how many times the loop will execute, e.g.
|
The code below shows how to use a do-while loop to print a list of increasingly larger positive random numbers until 1000 is reached.
|
How do you modify the above do-while loop so that it keeps looping only as long as the distance is less than 1000 AND you have called random no more than 20 times? This is the type of loop you will need to use in the Mandelbrot program below.
Read about the map function in the online Processing reference. The map function is very useful for rescaling numbers. For example, suppose you want to rescale pixel values (range 0 to 400) so that these values instead fall in the range of x= 1 to 2. (This is needed later to convert a pixel value to a value in the complex plane.) For example, what would the corresponding x value be for pixel 230? The image to the right, shows the relationship between the different map parameters. In this case, the x value would be 1.575
| Program 1: Using the Map Function | |
|

|
Program output: 1.575
|
|
You will need to use the map function in the Mandelbrot program to transform a pixel in the Processing window (as defined by the width and height) to the corresponding point in the complex plane as defined by minX, maxX, minY, and maxX. The picture is shown below. Imagine these to rectangles sitting on top of one another. Given an (i,j), you want to know what the corresponding value of (c_real, c_imag). You need to apply the map function twice, once to get c_real from i and again to get c_imag from j.
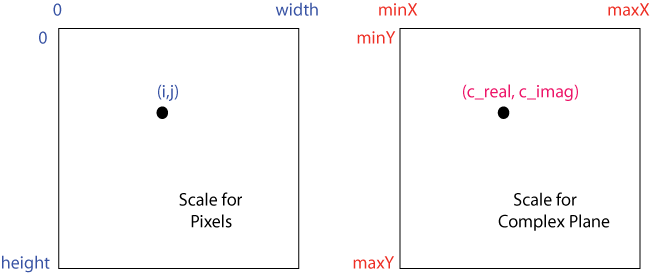
Before you proceed, try writing down these two map functions. Use Program 1 as a guide.
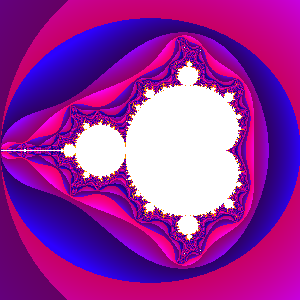
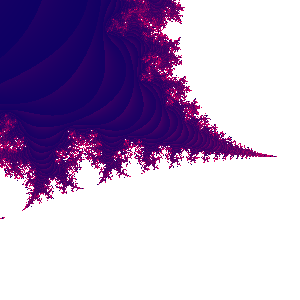
The Mandelbrot Set: Below is the code for drawing the Mandelbrot Set. Some sections are missing. You also need to add the tab for the Complex Number class (see Program 2 in Lab 7.) We will go over in class what needs to be put in these sections. When completed, the code should give the image on the right.
| Program 2: The Mandelbrot Set | |
|  |
Changing the region: The region of the complex plane that is drawn is given by minX,maxX, minY, and maxY. You can change these to zoom into specific regions of the plane. Try changing these values.
Setting the color: Remember that k varies from 0 to max=100. If the iteration converges (i.e. the length never exceeds 2), then we will have k=100. This corresponds to the white region. The black region corresponds to where the iteration blows up. The value of k is a measure of how fast it blows up (and so k will be less than 100). To get a range of colors in this region, modify the if-statement to include more values of k. For example, we can get three colors as follows:
|
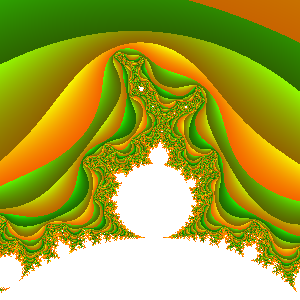
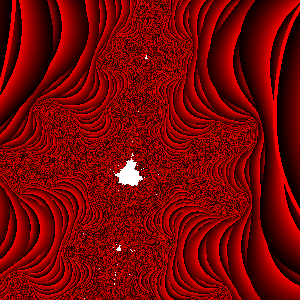
One can also use the final length of z to set the color. Experiment with changing colors and regions as was done here:
 | 
| 
|
 | 
| 
|
At the beginning of class on Friday, April 25:
On CS145/Lab8/ProcessingProjects, place your Mandelbrot Processing project which includes your different versions of setColor (e.g. you can call them setColor1, setColor2, etc).
On gorr-classes, in the folder CS145/Lab8/FinalImages, place the basic black and white Mandelbrot image as shown Program 2 as well as at least 4 uniquely different images generated by changing the region and method of coloring (setColor).
Be prepared to demonstrate your program in class.