Complex z = new Complex(.1,.21);
int pixels[][];
void setup() {
background(0);
size(300,300);
smooth();
colorMode(HSB, 100);
pixels = new int[width][height];
getStarted();
drawMe();
}
// We don't save these values
void getStarted() {
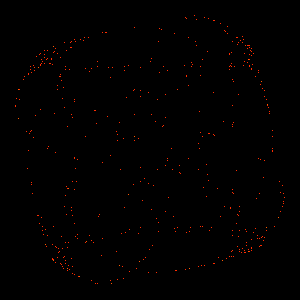
for (int i=0; i < 1000; i++) {
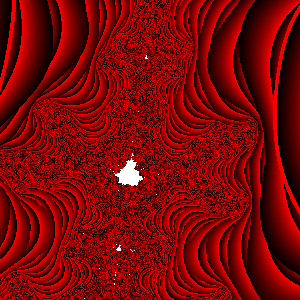
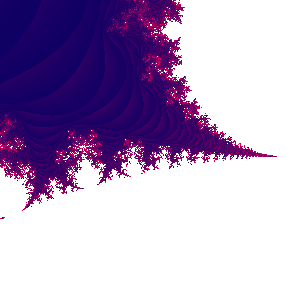
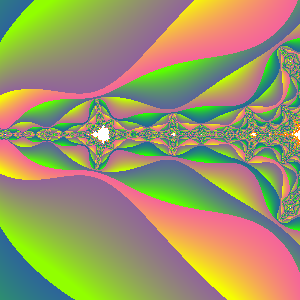
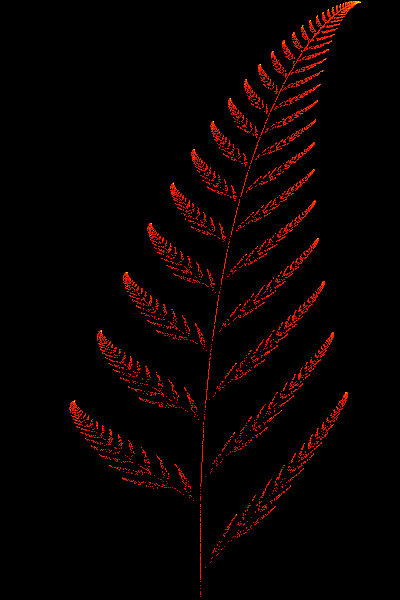
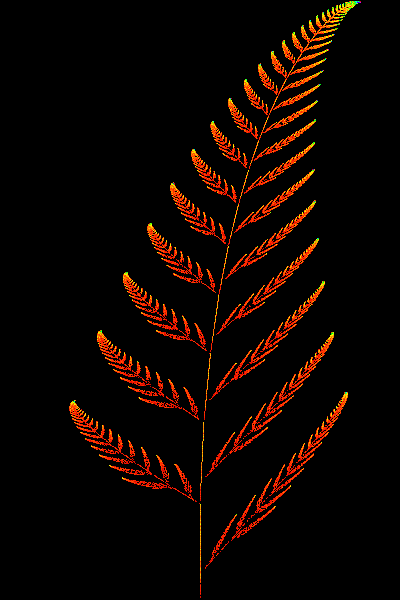
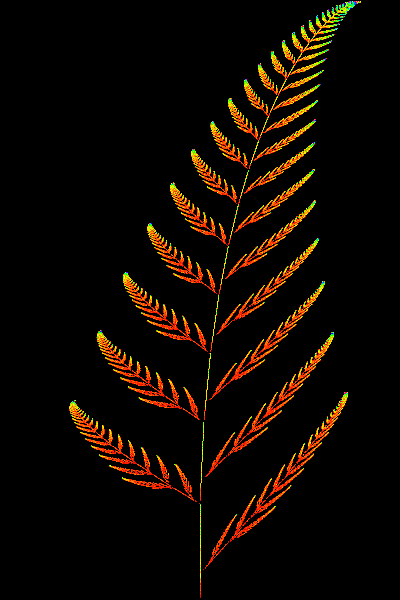
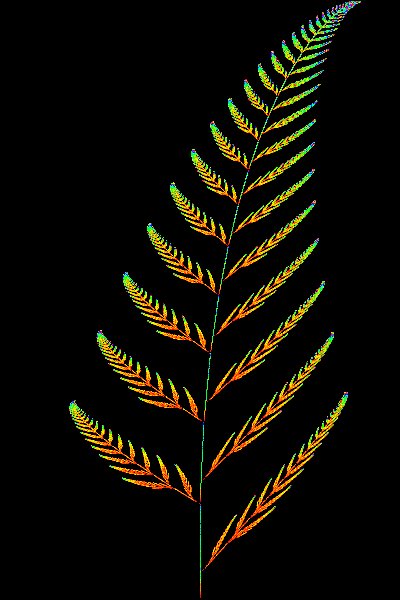
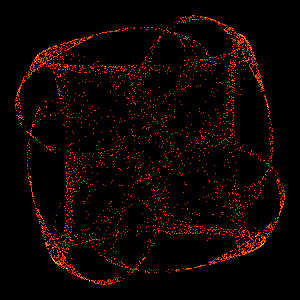
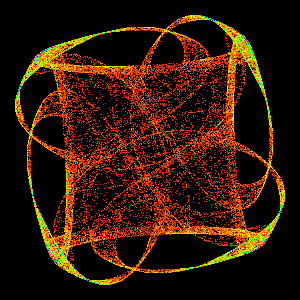
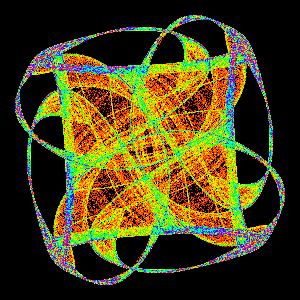
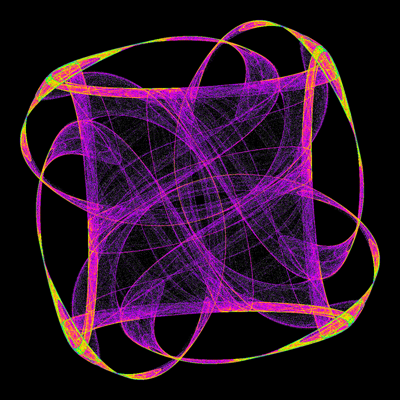
z = f(z,4,-1.86,2.0,0,1,.1); // Z4 symmetry
}
}
// We do save these values
void drawMe() {
for (int i=0; i < 500000; i++) {
z = f(z,4,-1.86,2.0,0,1,.1); // Z4 symmetry
put(z.real, z.imag);
}
}
// Draw the point and increase the count at that pixel.
void put(float real, float imag) {
int xval = (int) map(real,-1, 1, 0, width);
int yval = (int) map(imag,-1, 1, 0, height);
pixels[xval][yval]++;
stroke((3*pixels[xval][yval]) % 100,100,100);
point(xval,yval); // plot point in window
}
// This computes the function:
// f(z) = ( lambda + alpha*z*z_bar + beta*Re(z^n) + omega i )*z + gamma * z_bar^(n-1)
// where z_bar is the complex conjugate of z
// See book: Symmetry in Chaos, Field and Golubitsky
Complex f(Complex z, int n, float lambda, float alph, float beta, float gamma, float omega) {
Complex ans = new Complex(lambda,0);
ans = Complex.cAdd(ans, Complex.sMult(alph, Complex.cMult(z, Complex.conjugate(z)))); // lamda + alph*z*z_bar
ans = Complex.cAdd(ans, new Complex(beta*(Complex.pow(z,n).real), omega)); // + beta Re(z^n) + omega i
ans = Complex.cAdd( Complex.cMult(ans, z),Complex.sMult(gamma, Complex.pow(Complex.conjugate(z),n-1))); // z*ans + gamma* z_bar^(n-1)
return ans;
}
|  |